
This topic demonstrates the Zoom Pane of the igFinancialChart control.
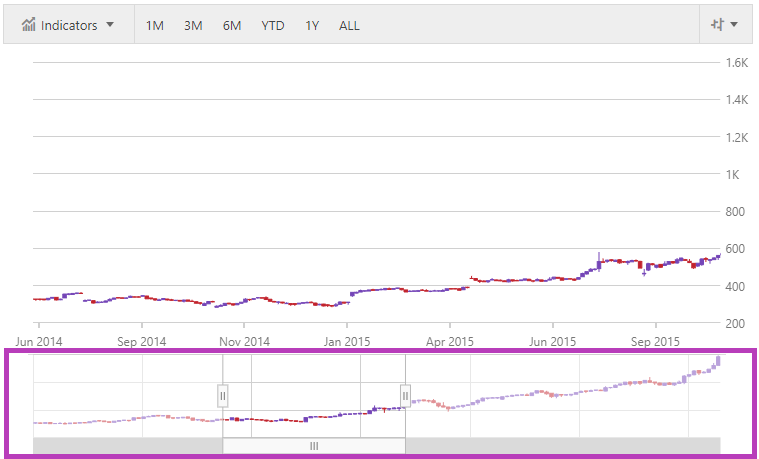
The above screenshot highlights the Zoom Pane of the chart. You may enable the Zoom Pane by setting the zoomSliderType option to a value other than None. To use the Zoom Pane, you can scroll the mouse wheel over another pane, you can click/drag to select an area of a pane to zoom, or you can adjust the Zoom Pane itself by the bars on the sides and scrollbar on the bottom.
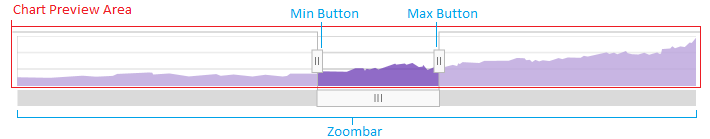
The Zoom Pane displays the Price Pane. You may choose a different chart type to render in the Zoom Pane than what is in the Price Pane. The below image points out the important areas of the Zoom Pane in more detail.
In JavaScript
$("#financialChart").igFinancialChart({
    dataSource: data,
    zoomSliderType: "Bar"
});
$("#financialChart").igFinancialChart("option", "zoomSliderType", "Bar");View on GitHub