
This topic presents the new features for the Ignite UI™ 2021 Volume 1 release.
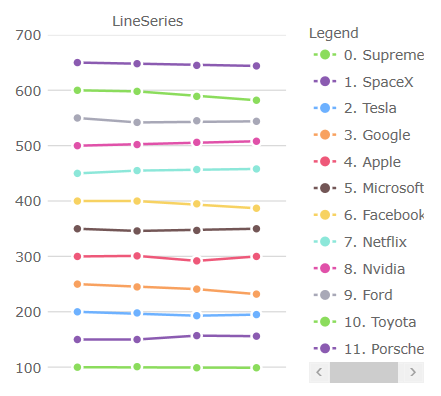
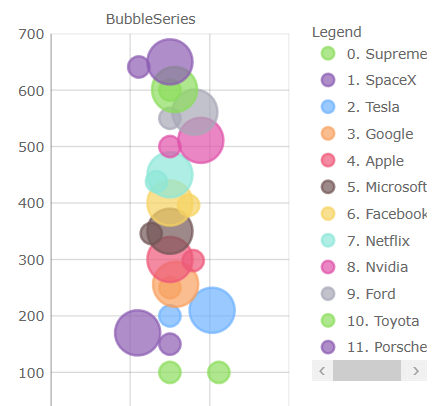
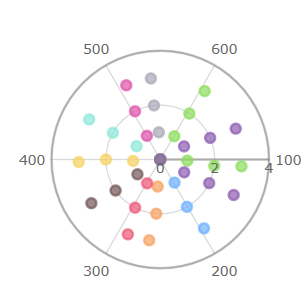
This release introduces several new and improved visual design and configuration options for all of the chart components. e.g. Data Chart, Category Chart, and Financial Chart.
 |
 |
|---|---|
 |
 |
Changed Bar/Column/Waterfall series to have square corners instead of rounded corners
Changed Scatter High Density series’ colors for min/max heat properties
Changed Financial/Waterfall series’ colors for negative fill of their visuals
Changed marker's thickness to 2px from 1px
Changed marker's fill to match the marker's outline for PointSeries, BubbleSeries, ScatterSeries, PolarScatterSeries
Note, you can use set MarkerFillMode property to Normal to undo this change
Compressed labelling for the TimeXAxis and OrdinalTimeXAxis
New Marker Properties:
MarkerFillMode - Can be set to 'MatchMarkerOutline' so the marker depends on the outline
MarkerFillOpacity - Can be set to a value 0 to 1MarkerOutlineMode - Can be set to 'MatchMarkerBrush' so the marker's outline depends on the fill brush color
New Series OutlineMode Property:
Can be set to toggle the series outline visibility. Note, for Data Chart, the property is on the series
The PlotAreaMargin properties defines the bleed over area introduced into the viewport when the chart is at the default zoom level. A common use case provide space between the axes and first/last data points. Note, the ComputedPlotAreaMarginMode, listed below, will automatically set the margin when markers are enabled. The others are designed to specify a certain thickness, where PlotAreaMargin provides a thickness to all four sides of the chart. These new properties were added:
PlotAreaMarginPlotAreaMarginLeftPlotAreaMarginTopPlotAreaMarginRightPlotAreaMarginBottomNew Highlighting Properties
Several configurations to the series highlighting as been added. In previous releases the highlighting was limited to fade on hover. These new properties were added:
HighlightingMode - Sets whether hovered or non-hovered series to fade, brightenHighlightingBehavior - Sets whether the series highlights depending on mouse position eg. directly over or nearest item
Added Highlighting for the following series:
Stacked
Shape
Added Annotation layers to the following series:
Stacked
Shape
Added support for overriding the data source of individual stack fragments within a stacked series
Added custom style events to Stacked, Scatter, Range, Polar, Radial, and Shape series
Added support to automatically sync the vertical zoom to the series content
Added support to automatically expanding the horizontal margins of the chart based on the initial labels displayed
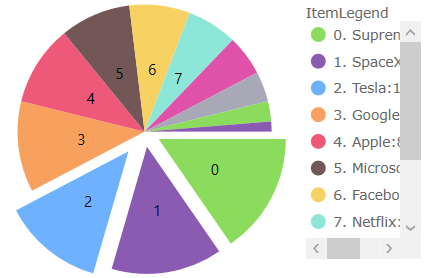
The following chart types can use ItemLegend in horizontal orientation:
Pie
LegendHighlightingMode - Enables series highlighting when hovering over legend items
Added support for wrap around display of the map (scroll infinitely horizontally)
Added support for shifting display of some map series while wrapping around the coordinate origin
Added support for highlighting of the shape series
Added support for some annotation layers for the shape series
View on GitHub