
This topic demonstrates how to bind data to the igFinancialChart control. At the end of each section, a complete code sample is provided.
This topic contains the following sections:
The procedure below demonstrates how to bind the igFinancialChart control to a data collection. The igFinancialChart allows you to bind to JavaScript arrays. Nested collections are also supported.
The ChartType property enables you to choose which series type you wish to display.
Supported series types:
Bar
Candle
Column
Line
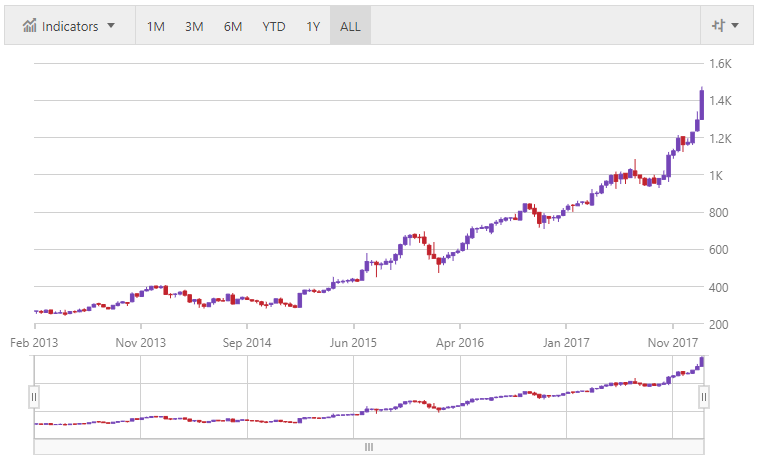
The igFinancialChart control as implemented by the binding to data sample code:
Defining a Data Model
Adding an Instance of the igFinancialChart control
(Optional) Verifying the result
Define Data
In JavaScript
function getData() {
    var data = PriceData.AMZN();
	return data;
}
Add an instance of the igFinancialChart Control
Add an instance of the igFinancialChart and bind it to the data:
In HTML
<div id="chart" style="width:800px;height:600px"></div>In JavaScript
$(function () {
    var data = getData();
    $("#chart").igFinancialChart({
    	dataSource: data
    });
});
(Optional) Verify the Result
Run your application to verify the result. If you have successfully bound the igFinancialChart control to the data collection, the resulting chart will look like the one shown above.
The following topics provide additional information related to this topic:
View on GitHub