
The igFinancialChart control allows you to determine what data you would like to show for your underlying data source’s time intervals.
The igFinancialChart allows you to exclude intervals of data on the X-Axis by placing TimeAxisBreaks in the chart’s XAxisBreaks collection.
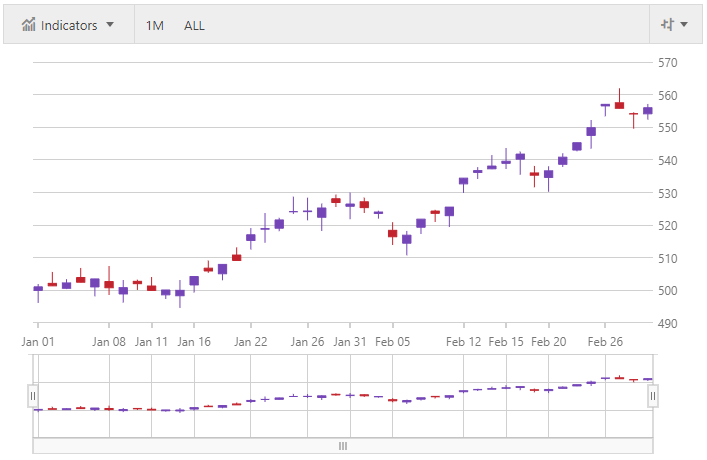
The following code example shows how to configure the XAxisBreaks collection to only show data not occurring on a weekend, resulting in a igFinancialChart like the one shown below.
In Javascript:
$(function () {

	$("#chart").igFinancialChart({
		dataSource: data,
		xAxisMode: "time",
		xAxisBreaks: [{
			start: new Date("2018-01-06T00:00:00"),
			end: new Date("2013-01-07T23:59:59"),
			interval: 7 * 24 * 60 * 60 * 1000
		}],
	});
});View on GitHub