
This topic explains using a code example how to add the igFinancialChart control to JQuery applications.
This topic contains the following sections:
The following procedure demonstrates adding the igFinancialChart to JQuery applications.
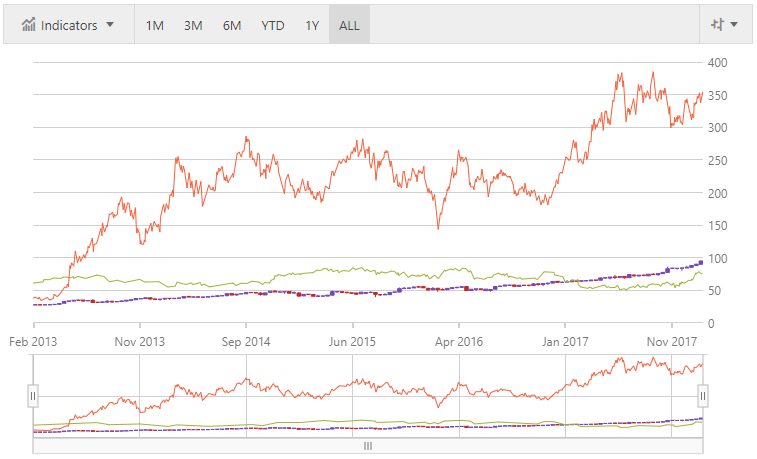
The following is a screenshot of the igFinancialChart
Following is a conceptual overview of the process:
1. Adding the igFinancialChart control to JQuery applications
2. Verifying the results
The following procedure takes you through the steps necessary for adding the igFinancialChart control to a page.
The following code demonstrates adding the igFinancialChart control with the minimum code and property settings required for display.
Add an element for the igFinancialChart to be attached:
In HTML
<body>
    <div id="financialChart"></div>
</body>
Attach the igFinancialChart to the element:
In JavaScript
$("#financialChart").igFinancialChart({ dataSource: data });Build and run your project to verify the result. If you have implemented the steps correctly, the displayed igFinancialChart should look like the one in the Preview section above.
The following topics provide additional information related to this topic:
View on GitHub