
The topics in this group explain both the Scatter Area and Scatter Contour series. Both series take a list of points containing three values (X, Y and Z) and triangulate these points using the X and Y values in order to generate a two-dimensional surface that is rendered on screen. The Z value is used for coloring the surface using a color scale. This allows an easy visualization of value changes across a two-dimensional space. An example might be displaying wifi strength across different locations in an office.
Figure 1. Scatter Area Series
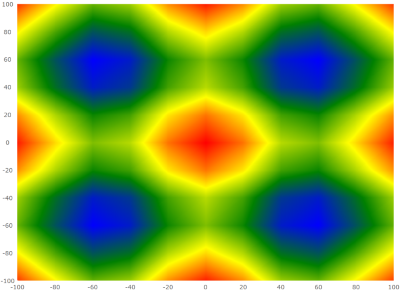
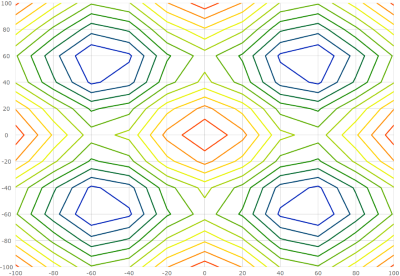
Figure 2. Scatter Contour Series
Configuring the Scatter Area Series (igDataChart): This topic provides information about the polygon series. It describes the properties of the polygon series and provides an implementation example.
Configuring the Scatter Contour Series (igDataChart): This topic provides information about the polyline series. It describes the properties of the polyline series and provides an implementation example.
View on GitHub