
This topic demonstrates how to bind both flat and hierarchical data to the igCategoryChart™ control. At the end of each section, a complete code sample is provided.
The procedure below demonstrates how to bind the igCategoryChart control to a data collection. The igCategoryChart allows you to bind to JavaScript arrays. Nested collections are also supported. In this topic you will define two sets of data collection (flat and hierarchical), add the Category Chart control to your application, and bind the control’s DataSource to an instance of the designated data collection.
This topic contains the following sections: This topic contains the following sections:
This procedure demonstrates how to bind the igCategoryChart control to a JavaScript data array.
To complete the procedure, you need the following:
For detailed information on instantiation and configuration of an igCategoryChart see Adding igCategoryChart.

The following steps demonstrate how to bind the igCategoryChart control to a JavaScript data array.
Define the data array
In Javascript
<script type="text/javascript">
   var data = [
      { "Label": "1995", "Brazil": 161, "Indonesia": 197, "United States": 266, "India": 920, "China": 1297 },
      { "Label": "2005", "Brazil": 186, "Indonesia": 229, "United States": 295, "India": 1090, China": 1216 },
      { "Label": "2015", "Brazil": 204, "Indonesia": 256, "United States": 322, "India": 1251, "China": 1361 },
      { "Label": "2025", "Brazil": 218, "Indonesia": 277, "United States": 351, "India": 1396, "China": 1394 }];
</script>
Add and configure igCategoryChart control
Add the chart div element to the web page. In the body of the web page, add a div element for the igCategoryChart control.
In HTML
<body>
   …
   <div id=”theChart”></div>
   <div id=”theLegend”></div>
   …
</body>
Instantiate igCategoryChart control and configure the data source
To do this, assign the data array defined in the previous step to the dataSource options of the igCategoryChart control.
In HTML
<script type="text/javascript">
$(function() {
            $("#theChart").igCategoryChart({
                chartType: "column",
       dataSource: data,
                legend: { element: "theLegend" }
            });
          });
</script>
This procedure demonstrates how to bind the igCategoryChart control to a “semi-nested” hierarchical JavaScript data array.
To complete the procedure, you need the following:
For detailed information on instantiation and configuration of an igCategoryChart see Adding igCategoryChart.
The following steps demonstrate how to bind the igCategoryChart control to a JavaScript data array.
Define the data array
In Javascript
<script>
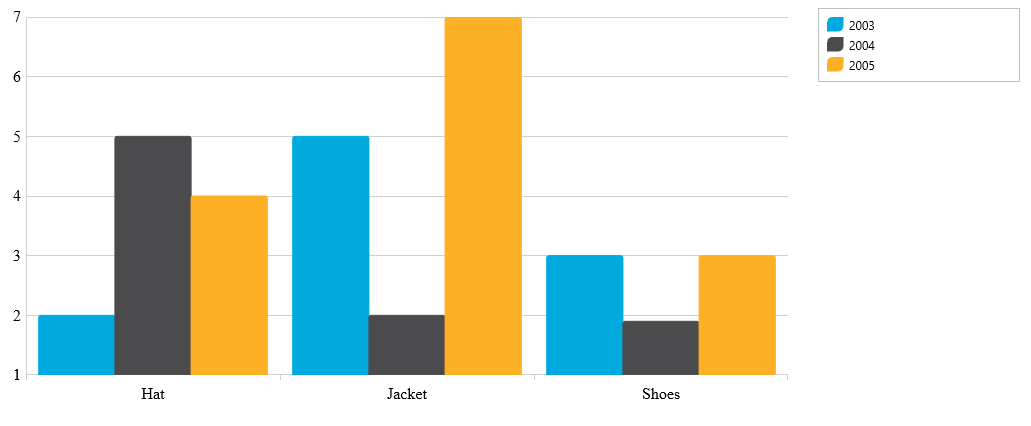
var data = [
[
[
{ "AmountSold": 2, "Item": "Hat" },
{ "AmountSold": 5, "Item": "Jacket" },
{ "AmountSold": 3, "Item": "Shoes" }
]
],
[
[
{ "AmountSold": 5, "Item": "Hat" },
{ "AmountSold": 2, "Item": "Jacket" },
{ "AmountSold": 1.9, "Item": "Shoes" }
]
],
[
[
{ "AmountSold": 4, "Item": "Hat" },
{ "AmountSold": 7, "Item": "Jacket" },
{ "AmountSold": 3, "Item": "Shoes" }
]
]
];
</script>
Add and configure igCategoryChart control
Add the chart div element to the web page. In the body of the web page, add a div element for the igCategoryChart control.
In HTML
<body>
   …
   <div id=”theChart”></div>
   <div id=”theLegend”></div>
   …
</body>
Instantiate igCategoryChart control and configure the data source and xAxis labels
To do this, assign the data array defined in the previous step to the dataSource options of the igCategoryChart control.
In HTML
<script type="text/javascript">
  $(function() {
    data[0].Label = "2003";
    data[1].Label = “2004";
    data[2].Label = "2005";

    $("#theChart").igCategoryChart({
       chartType: "column",
       dataSource: data,
       legend: { element: "theLegend" }
    });
  });
</script>
View on GitHub