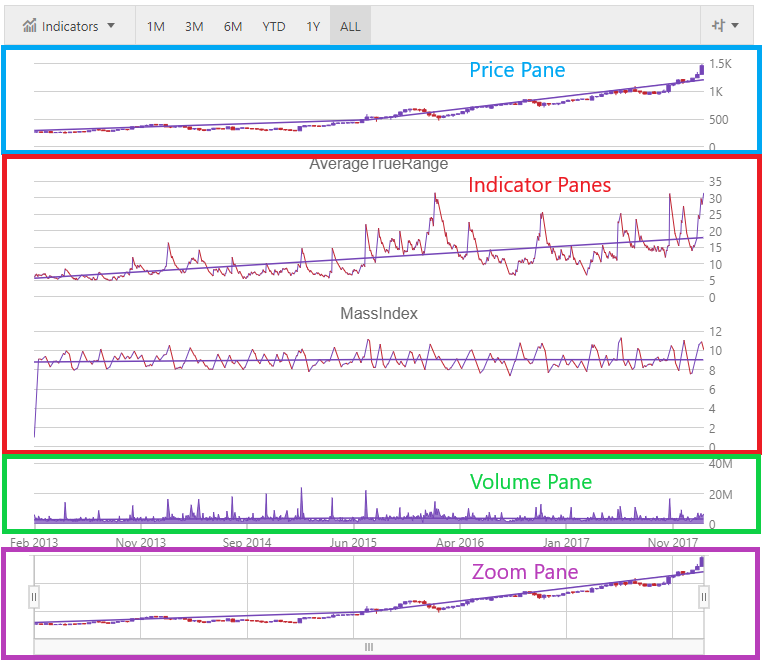

The igFinancialChart has multiple panes to display financial data. The panes for the igFinancialChart are the Price, Indicator, Volume and Zoom.
The following screenshot highlights the different panes:
The Price Pane renders prices using Line, Candlestick, Bar(OHLC), Column, trendlines and financial overlays.
The Indicator Panes renders all the financial indicators in a separate chart while the BollingerBands and PriceChannel overlays are rendered in the Price Pane because they share the same values range on Y-Axis.
The Volume Pane renders stocks volumes using Columns, Lines, and Area.
The Zoom Pane controls the zoom of all the panes.
View on GitHub