
This topic provides information about the callout layer annotations. It describes the properties of the callout layer and also provides an example of its implementation.
The following topics are prerequisites to understanding this topic:
Adding igDataChart: This topic demonstrates how to add the igDataChart™ control to a page and bind it to data.
Binding igDataChart to Data: This topic explains how to bind the igDataChart™ control to various data sources (JavaScript array, IQueryable<T>, web service).
This topic contains the following sections:
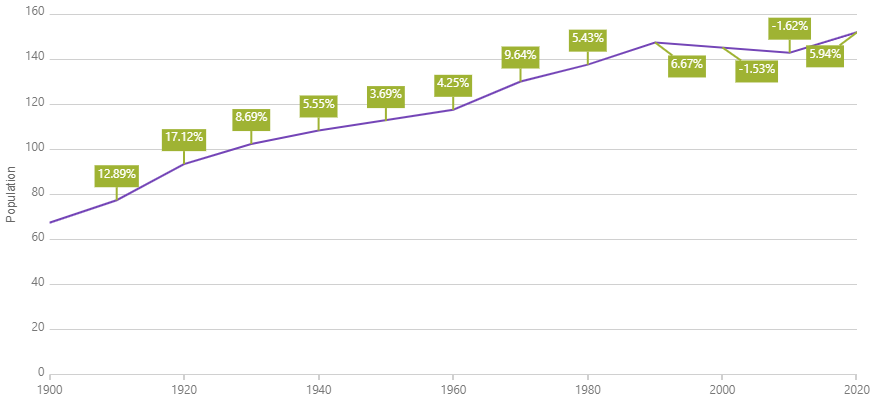
The calloutLayer displays annotations from existing or new data on the chart.
The following image is a preview of how the igDataChart control renders with the calloutLayer added.
The following table summarizes the properties of the calloutLayer layer.
| Property Name | Property Type | Description |
|---|---|---|
| dataSource | Array |
The data to be used for callout information. |
| labelMemberPath | String |
The path for your data that will be used as the annotation label. |
| xMemberPath | String |
The path for your data that will be used as the annotation's x position. |
| yMemberPath | String |
The path for your data that will be used as the annotation's y position. |
| isCalloutOffsettingEnabled | Boolean |
True if callout positions will be adjusted from collision resolution. |
The code snippet below demonstrates how to configure a couple callout layers.
In HTML:
$(function () {
    $("#chart1").igDataChart({
        series: [
            {
                name: "calloutSeriesUsa",
                type: "calloutLayer",
                dataSource: usaCallouts,
                xMemberPath: "Index",
                yMemberPath: "Value",
                labelMemberPath: "Label"
            },
            {
                name: "calloutSeriesRus",
                type: "calloutLayer",
                dataSource: rusCallouts,
                xMemberPath: "Index",
                yMemberPath: "Value",
                labelMemberPath: "Label"
            }
        ]
    });
});
igDataChart control including the different types of hover interaction layers available.The following samples provide additional information related to this topic.
igDataChartView on GitHub