
This topic provides information about the final value layer annotations. It describes the properties of the final value layer and also provides an example of its implementation.
The following topics are prerequisites to understanding this topic:
Adding igDataChart: This topic demonstrates how to add the igDataChart™ control to a page and bind it to data.
Binding igDataChart to Data: This topic explains how to bind the igDataChart™ control to various data sources (JavaScript array, IQueryable<T>, web service).
This topic contains the following sections:
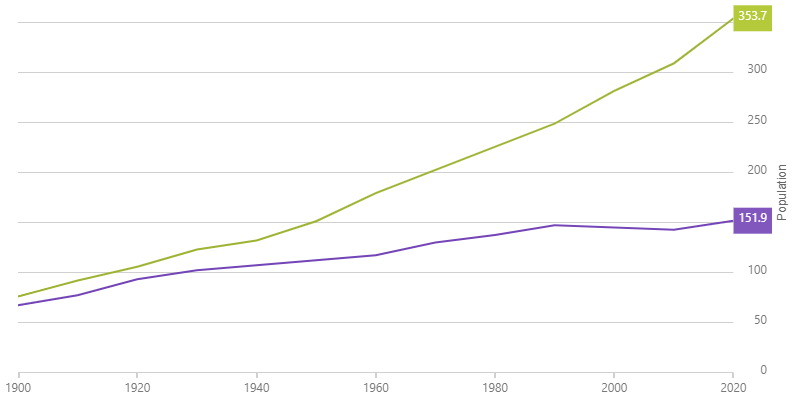
The finalValueLayer displays annotations based on the final value of data in the chart.
The following image is a preview of how the igDataChart control renders with the finalValueLayer added.
The following table summarizes the properties of the finalValueLayer layer.
| Property Name | Property Type | Description |
|---|---|---|
| finalValueSelectionMode | enumeration |
Specifies method for how the final value is identified. |
The code snippet below demonstrates how to enable the final value layer.
In HTML:
$(function () {
    $("#chart1").igDataChart({
        series: [
            {
                name: "finalValueSeries",
                type: "finalValueLayer"
            }
        ]
    });
});
igDataChart control including the different types of hover interaction layers available.The following samples provide additional information related to this topic.
igDataChart.View on GitHub