
This topic demonstrates, with code examples, how to add the igLinearGauge™ control to an HTML page.
The following topics are prerequisites to understanding this topic:
igLinearGauge™ control including its main features, minimum requirements, and user functionality.This topic contains the following sections:
To add igLinearGauge control to a web page requires an HTML element, a <div> to serve as the base for instantiation. The basic configuration of igLinearGauge requires providing values for its dimensions - width and height.
The following table summarizes the requirements for using the igLinearGauge control.
| Required Resources | Description | What you need to do… | ||||||||||||||
|---|---|---|---|---|---|---|---|---|---|---|---|---|---|---|---|---|
| jQuery and jQuery UI JavaScript resources | Ignite UI for jQuery™ is built on top of the following frameworks: |
Add script references to both libraries in the <head> section of your page.
|
||||||||||||||
| General igLinearGauge JavaScript Resources |
The igLinearGauge control depends on functionality distributed across several files in the Ignite UI for jQuery Library. You can load the required resources in one of the following ways:
|
Add one of the following:
|
Following are the general conceptual steps for adding igLinearGauge to an HTML Page:
Creating the target element for storing the igLinearGauge control
Instantiating the igLinearGauge control
Configuring the basic rendering options
Configuring the scale
Adding needle
Adding comparative ranges
This procedure adds an instance of igLinearGauge to an HTML page and configures its dimensions, its scale and adds a needle and three comparative ranges to it.
The procedure presumes the required resources are added to the header of the HTML page, so it instantiates the igLinearGauge control in the document ready event to prevent any errors due to DOM being not fully loaded.
The following screenshot is a preview of the result.
To complete the procedure, you need the required JavaScript and CSS files referenced on the HTML page.
In HTML:
<!DOCTYPE html>
<html>
<head>
    <!-- Ignite UI for jQuery Required Combined CSS Files -->
    <link href="../../igniteui/css/themes/infragistics/infragistics.theme.css" rel="stylesheet" />
    <link href="../../igniteui/css/structure/infragistics.css" rel="stylesheet"/>
    <script type="text/javascript" src="../../js/jquery.min.js"></script>
    <script type="text/javascript" src="../../js/jquery-ui.js"></script>
    <!-- Linear Gauge Required JavaScript Files -->
    <script type="text/javascript" src="../../igniteui/js/modules/infragistics.util.js"></script>
    <script type="text/javascript" src="../../igniteui/js/modules/infragistics.util.jquery.js"></script>
    <script type="text/javascript" src="../../igniteui/js/modules/infragistics.ui.widget.js"></script>
    <script type="text/javascript" src="../../igniteui/js/modules/infragistics.ext_core.js"></script>
    <script type="text/javascript" src="../../igniteui/js/modules/infragistics.ext_collections.js"></script>
    <script type="text/javascript" src="../../igniteui/js/modules/infragistics.ext_ui.js"></script>
    <script type="text/javascript" src="../../igniteui/js/modules/infragistics.dv_jquerydom.js" ></script>
    <script type="text/javascript" src="../../igniteui/js/modules/infragistics.dv_core.js"></script>
    <script type="text/javascript" src="../../igniteui/js/modules/infragistics.dv_geometry.js"></script>
    <script type="text/javascript" src="../../igniteui/js/modules/infragistics.dv_interactivity.js"></script>
    <script type="text/javascript" src="../../igniteui/js/modules/infragistics.dv_visualdata.js"></script>
    <script type="text/javascript" src="../../igniteui/js/modules/infragistics.lineargauge.js"></script>
    <script type="text/javascript" src="../../igniteui/js/modules/infragistics.ui.lineargauge.js"></script>
</head>
<body>
</body>
</html>
Follow these steps to add an igLinearGauge to an HTML page.
Create the target element for storing the igLinearGauge control.
Create a <div> element within the HTML body on which to instantiate the igLinearGauge control.
In HTML:
 <body>
     <!-- Target element for the igLinearGauge -->
       <div id="linearGauge"></div>
 </body>
Instantiate the igLinearGauge control.
Use the selector of the target element defined in step 1 to instantiate the igLinearGauge control.
In HTML:
 <script type="text/javascript">
     $(function () {
         $("#linearGauge").igLinearGauge({
         });
     });
 </script>
Configure the basic rendering options.
When instantiating the igLinearGauge, configure the width and height options.
In HTML:
 $("#linearGauge").igLinearGauge({
     width: "300px",
     height: "70px"
 });
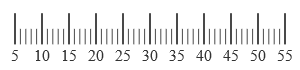
Configure the scale.
In order to customize the values of the scale, you need to set its minimumValue and maximumValue properties. In this example, the scale will start at 5 and end at 55.
In HTML:
 $("#linearGauge").igLinearGauge({
     width: "300px",
     height: "70px",
     minimumValue: "5",
     maximumValue: "55"
 });
The changed scale is shown on the following screenshot:
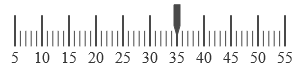
Add a needle.
The primary measure of the igLinearGauge is visualized by its needle. Its value is managed by the value property setting. For this example, set the value property to 35.
In HTML:
 $("#linearGauge").igLinearGauge({
         …
     value:"35"
 });
The following screenshot displays what the igLinearGauge control would look so far in the procedure.
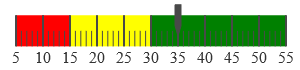
Add comparative ranges.
In order to compare the value displayed by the performance bar against some meaningful range(s) of values, these comparative ranges need to be displayed on the scale. Comparative ranges are managed by ranges property within which several individual ranges can be defined, each of which having its own starting and ending values (startValue and endValue) and color (brush). For this example, configure 3 comparative ranges, each of a different shade of gray, starting at the 0, 15, and 30 tick marks of the scale, respectively.
In HTML:
 $("#linearGauge").igLinearGauge({
     …
     ranges: [{
         name: 'range1',
         startValue: 0,
         endValue: 15,
         brush: 'red'
     },
     {
         name: 'range2',
         startValue: 15,
         endValue: 30,
         brush: 'yellow'
     },
     {
         name: 'range3',
         startValue: 30,
         endValue: 55,
         brush: 'green'
     }
     ]
 });
The final look of the graph is presented below.
Following is the full code for this procedure.
In HTML:
<!DOCTYPE html>
<html>
<head>
    <!-- Ignite UI for jQuery Required Combined CSS Files -->
    <link href="../../igniteui/css/themes/infragistics/infragistics.theme.css" rel="stylesheet" />
    <link href="../../igniteui/css/structure/infragistics.css" rel="stylesheet"/>
    <script type="text/javascript" src="../../js/jquery.min.js"></script>
    <script type="text/javascript" src="../../js/jquery-ui.js"></script>
    <!-- Linear Gauge Required JavaScript Files -->
    <script type="text/javascript" src="../../igniteui/js/modules/infragistics.util.js"></script>
    <script type="text/javascript" src="../../igniteui/js/modules/infragistics.util.jquery.js"></script>
    <script type="text/javascript" src="../../igniteui/js/modules/infragistics.ui.widget.js"></script>
    <script type="text/javascript" src="../../igniteui/js/modules/infragistics.ext_core.js"></script>
    <script type="text/javascript" src="../../igniteui/js/modules/infragistics.ext_collections.js"></script>
    <script type="text/javascript" src="../../igniteui/js/modules/infragistics.ext_ui.js"></script>
    <script type="text/javascript" src="../../igniteui/js/modules/infragistics.dv_jquerydom.js" ></script>
    <script type="text/javascript" src="../../igniteui/js/modules/infragistics.dv_core.js"></script>
    <script type="text/javascript" src="../../igniteui/js/modules/infragistics.dv_geometry.js"></script>
    <script type="text/javascript" src="../../igniteui/js/modules/infragistics.dv_visualdata.js"></script>
    <script type="text/javascript" src="../../igniteui/js/modules/infragistics.lineargauge.js"></script>
    <script type="text/javascript" src="../../igniteui/js/modules/infragistics.ui.lineargauge.js"></script>
    <script type="text/javascript">
        $(function () {
            $("#linearGauge").igLinearGauge({
                width: "300px",
                height: "70px",
                minimumValue: "5",
                maximumValue: "55",
                value:"35",
                ranges: [{
                    name: 'range1',
                    startValue: 0,
                    endValue: 15,
                    brush: 'red
                },
                {
                    name: 'range2',
                    startValue: 15,
                    endValue: 30,
                    brush: 'yellow'
                },
                {
                    name: 'range3',
                    startValue: 30,
                    endValue: 55,
                    brush: 'green'
                }
                ]
            });
        });
    </script>
</head>
<body>
    <!-- Target element for the igLinearGauge -->
      <div id="linearGauge"></div>
</body>
</html>
The following topics provide additional information related to this topic.
Adding igLinearGauge to an ASP.NET MVC Application: This topic demonstrates, with code examples, how to add the igLinearGauge control to an ASP.NET MVC View using the ASP.NET MVC helper.
jQuery and MVC API Links (igLinearGauge): This topic provides links to the API reference documentation about the igLinearGauge control and the ASP.NET MVC Helper for it.
The following sample provides additional information related to this topic.
igLinearGauge control.View on GitHub