
The igFinancialChart is a lightweight, high-performance chart. This chart can be easily configured to display financial data using an extremely simple and intuitive API. All you need to do is bind your data (a collection or a collection of collections) and the chart takes care of everything else. The chart offers multiple ways for the user to visualize and interpret the data, including several display modes for price and volume, and many financial indicators. The chart also makes use of label formatting to give the data context.
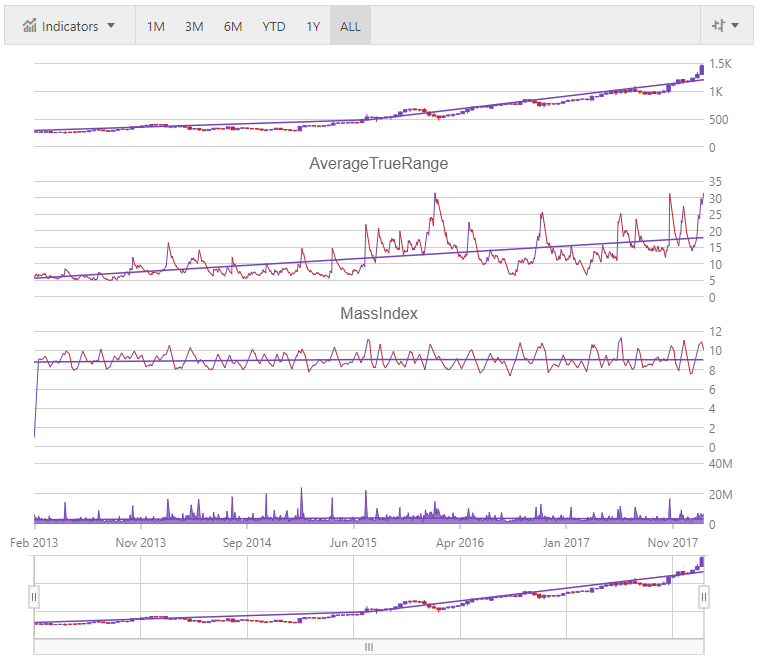
The following screenshot demonstrates a column series displayed within the Financial Chart.
You can explicitly specify the chart type by setting the ChartType to:
Bar
Candle
Column
Line
An example of the intuitive behavior of the Financial Chart control is that you do not need to explicitly tell it which columns to use for data. First it will look for Open, High, Low, Close, Volume and Date columns to interpret the data. If it does not find those columns in the data source it will use the first 6 numeric columns and the first date.
Built to be easily configurable, it uses the Data Chart control as its engine, which means that it benefits from the high performing and powerful Data Chart. You can also utilize the features of the Data Chart control if desired.
View on GitHub