
This topic demonstrates, with code examples, how to use TimeXAxis in the igDataChart™ control. The benefit of using TimeXAxis is to dynamically change label formats as you zoom in or out of the data. In addition, axis breaks can be created which omit dates within a range. For example, weekends can be skipped.
This topic is organized as follows:
Note: The following sections are only required if the default labels (i.e. formatting and intervals) need to be changed.
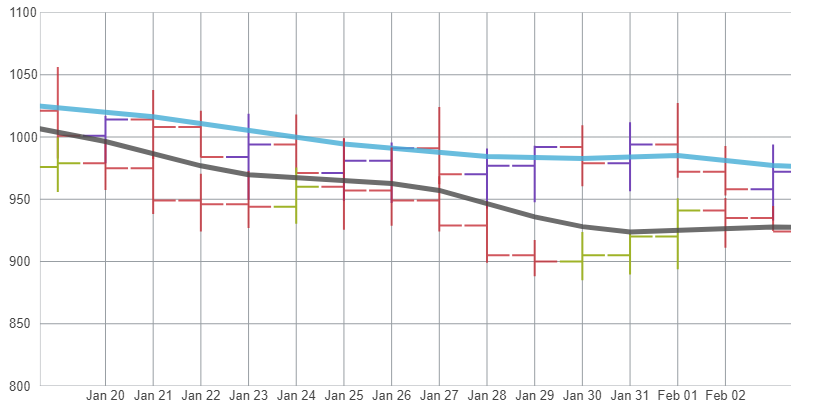
Figure 2: Sample implementation of the TimeXAxis
The TimeXAxis may be used with the following series:
For more information on what axis types are required by a specific series, refer to the Series Requirements topic.
Note: All category axes require data binding and data mapping in order to show labels on the axis lines. Refer to the Getting Started with Data Chart topic for code example how to bind data to the category.
The TimeXAxis has the option to exclude intervals of data with Breaks. As a result, labels will not appear at the excluded interval. For example, working/non-working, holidays, and/or weekends.
Several axis breaks can be added to the Breaks property and configured by using a unique Start, End and Interval.
| Property Name | Property Type | Description |
|---|---|---|
Breaks |
array | A list of axis label intervals. The interval selected is according to the visible axis range. |
Start |
Date | The start time of the axis break. |
End |
Date | The end time of the axis break. |
Interval |
number | The interval at which to repeat this break, expressed as a Date. |
The following code snippets show how to skip labels on the TimeXAxis in the XamDataChart for a range of years, causing uneven intervals. The result is shown in Figure 4 below.
In Javascript:
```js
<script type="text/javascript">
    $(function () {
        $("#chart").igDataChart({
            dataSource: data,
            axes: [{
                type: "time",
                name: "xAxis",
                dateTimeMemberPath: "Date"
                label: "DateString",
                breaks: [{
                    start: new Date("2009-12-26T00:00:00"),
                    end: new Date("2009-12-27T23:59:59.99"),
                    interval: 7 * 24 * 60 * 60 * 1000
                    }],
            }, {
                type: "numericY",
                name: "yAxis",
            }],
        });
    });
</script>
```
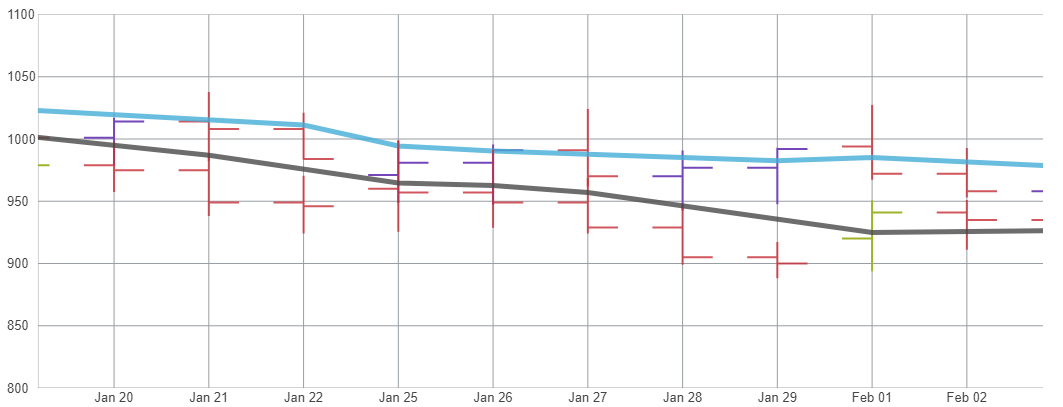 Figure 4: TimeXAxis displaying data from Monday through Friday in 2010.
The TimeXAxis has the following label format properties:
An instance of TimeAxisLabelFormat can be added to the LabelFormatsproperty associated with each interval allowed, including a unique Format and Range. This can be especially useful for drilling data from years to milliseconds to adjust the labels depending visible axis range.
| Property Name | Property Type | Description |
|---|---|---|
LabelFormats |
array | A list of label formats. The label format selected will be the one with the largest range smaller than the visible range of the axis. |
Format |
string | The DateTime format string to apply according to the visible axis range. |
Range |
number | The axis range threshold at which to apply the label format, represented in milliseconds. |
Configurations can be customized by using the Format and Range properties of each TimeAxisLabelFormat that is added to the axis. eg. The following lists a typical set of label formats for the given amount of time in view:
In Javascript:
```js
<script type="text/javascript">
    $(function () {
        $("#chart").igDataChart({
            dataSource: data,
            axes: [{
                type: "time",
                name: "xAxis",
                dateTimeMemberPath: "Date",
                labelFormats: [
                {
                   format: "hh:mm:ss",
                   range: 1000
                },
                {
                   format: "hh:mm",
                   range: 60 * 1000
                },
                {
                   format: "MMM dd",
                   range: 24 * 60 * 60 * 1000
                },
                {
                   format: "MMM yy",
                   range: 365.24 * 24 * 60 * 60 * 1000
                },
                {
                   format: "yyyy",
                   range: 5 * 365 * 24 * 60 * 60 * 1000
                }],
            },
        });
    });
</script>
```
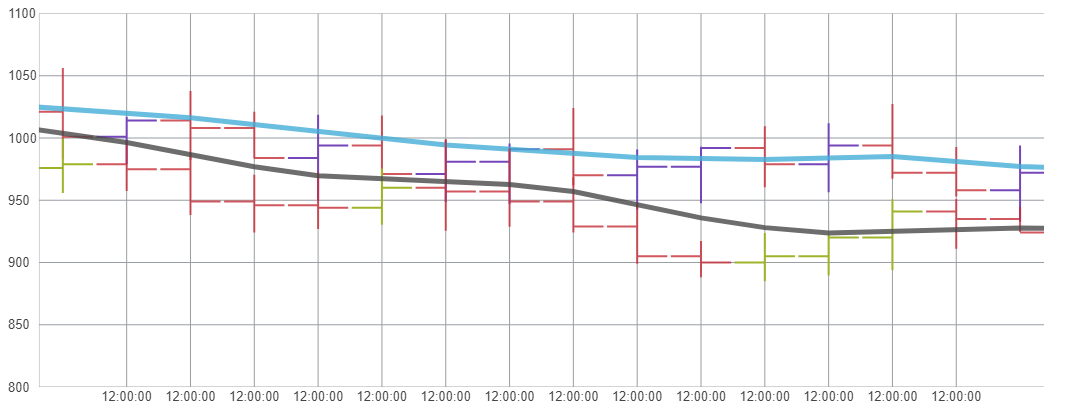
Figure 2: The XamDataChart control with a custom TimeAxisLabelFormat of "hh:mm:ss"
The TimeXAxis provides an Intervals collection of type TimeAxisInterval. Each TimeAxisInterval added to the collection is responsible for assigning a unique Interval, Range, and IntervalType.
An instance of TimeAxisInterval can be added to the Intervals property associated with each IntervalType, including a unique Interval and Range. This can be especially useful for drilling data from years to milliseconds to provide unique spacing between labels depending on the range of time shown by the chart.
| Property Name | Property Type | Description |
|---|---|---|
Intervals |
array | A list of axis label intervals. The interval selected is according to the visible axis range. |
Interval |
number | The interval, expressed as a multiple of IntervalType. |
IntervalType |
enumeration | The unit of time for the interval. |
Range |
number | The axis range threshold at which to apply the label format, represented in milliseconds. |
The following code snippet demonstrates how to implement several Intervals for each IntervalType XamDataChart control. The result is shown in Figure 3 below.
```js
<script type="text/javascript">
    $(function () {
        $("#chart").igDataChart({
            dataSource: data,
            axes: [{
                type: "time",
                name: "xAxis",
                dateTimeMemberPath: "Date",
                intervals: [
                {
                    intervalType: "Seconds",
                    interval: 36,
                    Range: 1000
                },
                {
                    intervalType: "Minutes",
                    interval: 5,
                    Range: 60 * 1000
                },
                {
                    intervalType: "Hours",
                    interval: 1,
                    Range: 60 * 60 * 1000
                },
                {
                    intervalType: "Days",
                    interval: 12,
                    Range: 24 * 60 * 60 * 1000
                },
                {
                    intervalType: "Months",
                    interval: 12,
                    Range: 365.24 * 24 * 60 * 60 * 1000
                },
                {
                    intervalType: "Years",
                    interval: 1,
                    Range: 5 * 365 * 24 * 60 * 60 * 1000
                }],
            },
        });
    });
</script>
```
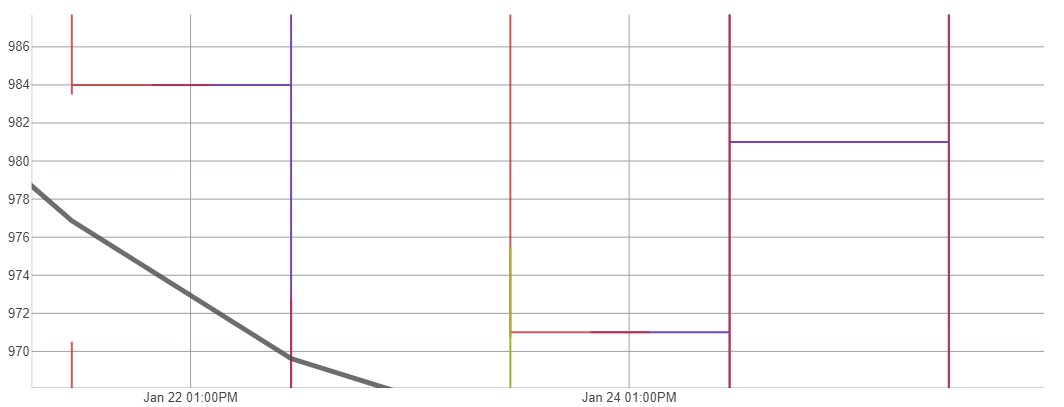 Figure 3: TimeXAxis displaying data every 48 hours.
The following topic provides additional information related to this topic:
igDataChart control to a page and bind it to data.The following sample provides additional information related to this topic.
igDataChart control.View on GitHub