This topic provides information on enabling the series highlighting feature along with a listing of the supported series. This topic also explains how to configure the series highlighting using the available events.
The following topic is a prerequisite to understanding this topic:
This topic demonstrates how to add the igDataChart™ control to a page and bind it to data.
This topic contains the following sections:
This feature allows you to highlight an entire series or individual items within the series. For example, highlights the entire line in a series such as the lineSeries as it is all one shape; however, highlights can be applied to each individual column in a series such as columnSeries. Individual markers can be highlighted in all supported series.
Currently the feature only supports highlighting via the mouse.
The series highlighting feature is supported for the following series types:
RangeCategory Series
Financial Price Series
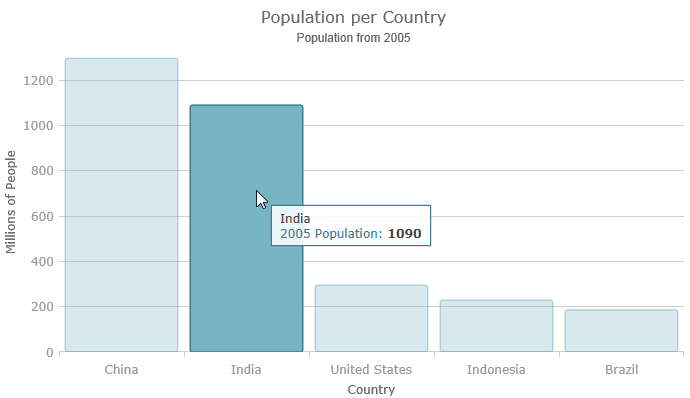
The following screenshot is a preview of the igDataChart control with a columnSeries and the series highlighting feature enabled.
The following table summarizes the properties used for series highlighting. These properties are set on the supported series.
| Property Name | Property Type | Description |
|---|---|---|
| isHighlightingEnabled | boolean | Enables the series highlighting feature, by default it is set to False. |
| highlightingTransitionDuration | timeSpan | Determines the duration that the highlighting change takes. |
This sample demonstrates the series highlighting feature on different series types by configuring the isHighlightingEnabled and highlightingTransitionDuration series properties.
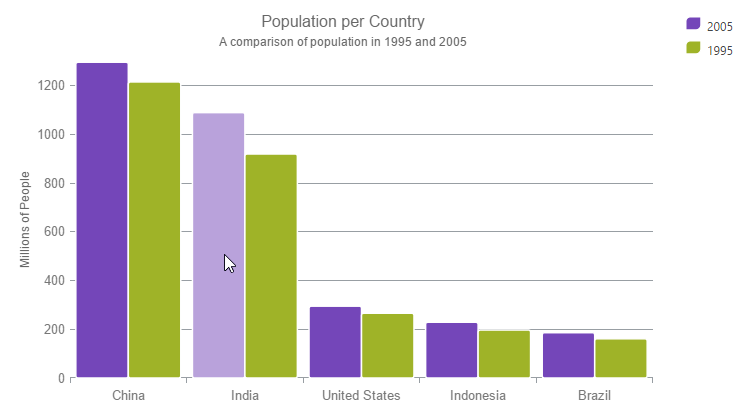
The following example shows the same functionality, applied to a financial chart.
There are two events that are specifically related to the series highlighting feature.
assigningCategoryStyleassigningCategoryMarkerStyleThese events can be configured to achieve the following:
lineSeries, or each individual item in the series for the series having individual items such as columnSeries.When using the above series to configure the highlighting on the series, only the properties that are available on that particular series can be used. For example, overriding the fill or radiusX property of a lineSeries does not have any affect since those properties do not affect the lineSeries.
The following table summarizes the properties of the assigningCategoryStyleEventArgsBase.
| Property Name | Property Type | Description |
|---|---|---|
| startIndex | int | Start index of the range of data that is currently being highlighted. |
| endIndex | int | End index of the range of the data that is currently being highlighted. |
| startDate | dateTime | Start date of the range of data that is currently being highlighted. |
| endDate | dateTime | End date of the range of data that is currently being highlighted. |
| getItems | getCategoryItemsEventHandler | Actual items from the data source being highlighted. However, if there is a lot of data and you called it every time the event was fired, will negatively impact performance. |
| Fill | brush | Overrides the default fill property of the series. However, this property only takes affect if the Fill property only affects that particular series. |
| stroke | brush | Overrides the default stroke property of the series. |
| opacity | double | Overrides the default the opacity property of the series. |
| highlightingInfo | higlightingInfo | Determine the styling of the highlighted series. |
| maxAllSeriesHighlightingProgress | double | Progress state of the highlighting of the series. Value from 0 to 1. |
| sumAllSeriesHighlightingProgress | double | Progress state of the highlighting of the series. Value from 0 to 1. |
| highlightingHandled | bool | When set to True the default highlighting does not apply. |
| HasDateRange | bool |
The following table summarizes the properties of the assigningCategoryMarkerStyleEventArgs
| Property Name | Property Type | Description |
|---|---|---|
| strokeThickness | double | Overrides the default StrokeThickness property of the marker. |
| strokeDashArray | doubleCollection | Overrides the default StrokeDashArray property of the marker. |
| strokeDashCap | penLineCap | Overrides the default StrokeDashCap property of the marker. |
| radiusX | double | Overrides the default RadiusX property. |
| radiusY | double | Overrides the default RadiusY property. |
The following example shows the usage of the assigningCategoryStyle event to change the highlighting feature to fade non highlighting columns instead of changing the highlighting column.
The following topic provides additional information related to this topic:
igDataChart control to a page and bind it to data.View on GitHub