
This topic explains how to configure selection and explosion for the slices of the igDoughnutChart™.
The following concept is required for understanding this topic:
igDoughnutChart Overview: This topic provides an overall look at the igDoughnutChart control.
Adding igDoughnutChart: This is a group of topics demonstrating how to add the igDoughnutChart control to an HTML page and to an ASP.NET MVC application.
This topic contains the following sections:
The following table lists the configurable aspects of the igDoughnutChart control related to slice selection.
| Configurable aspect | Details | Properties / Events |
|---|---|---|
| Enable/disable slice selection | You can enable or disable the ability to select slices or not. | allowSliceSelection |
| Configuring the look of the selected slices |
You can define how the selected slices will look by defining a style and assigning it to the selectedStyle property of the igDoughnutChart control.
|
selectedStyle |
| Changing the selection state upon slice click |
If you attach an event handler for the sliceClick event, it supplies a reference to the clicked slice in the event arguments allowing you to modify its selection state.
|
You can alternately enable (default setting) or disable slice selection in the igDoughnutChart.
Note: You must perform all the remaining slice selection configurations in this topic with slice selection enabled.
The following table maps the desired behavior to property settings.
| In order to: | Use this property: | And set it to: |
|---|---|---|
| Enable/Disable slice selection | allowSliceSelection |
true or false |
The igDoughnutChart exposes a selectedStyle property that determines the look of the selected slices. By default, no style is applied, and selecting a slice will not alter its appearance in any way. In order to apply your own style to the selected slices, you need to define a style first and then configure it as the value of the selectedStyle property. Apart from setting a style that would apply to the slices of all series, it is also possible to specify different styles for the different series by assigning a separate style to each series’ selectedStyle property.
The following table maps the desired behavior to property settings.
| In order to: | Use this property: | And set it to: |
|---|---|---|
| Configure the look for selected slices | selectedStyle |
A style. |
The screenshot below demonstrates how the igDoughnutChart control looks as a result of the following settings:
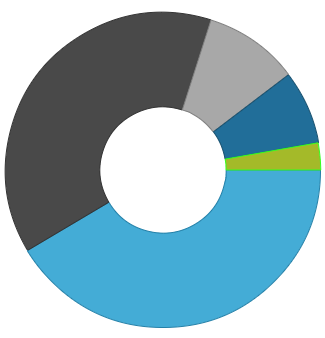
Following is the code that implements this example.
In HTML:
<html>
<head>
    …
    $(function () {
        var dc = $("#doughnutChart").igDoughnutChart({
            …
            series: [
                {
                    name: "flatSeries",
                    valueMemberPath: "Index",
                    dataSource: data,
                    labelMemberPath: 'ProductCategory',
                    selectedStyle: { stroke: '#31FF1E' },
                }
            ]
       });
    });
    </script>
</head>
<body>
    <!-- Target element for the igDoughnutChart -->
    <div id="doughnutChart"></div>
</body>
</html>
The igDoughnutChart exposes a sliceClick event used to change the selected/unselected state of a slice.
The following table maps the desired behavior to property settings.
| In order to: | Use this event / property: | What to do: |
|---|---|---|
Set the isSelected property |
sliceClick isSelected |
Set the isSelected property to true or false. |
The following code example demonstrates how to toggle the selection state of slices upon click.
In HTML:
<html>
<head>
    …
    $(function () {
            var dc = $("#doughnutChart").igDoughnutChart({
            width: 350,
            height: 350,
            sliceClick: function (event, ui) {
                ui.slice.isSelected = !ui.slice.isSelected;
            },
            series: [
                {
                    …
                }
            ]
       });
    });
    </script>
</head>
<body>
    <!-- Target element for the igDoughnutChart -->
    <div id="doughnutChart"></div>
</body>
</html>
The following table lists the configurable aspects of the igDoughnutChart control related to slice explosion.
| Configurable aspect | Details | Properties / Events |
|---|---|---|
| Enable/disable slice explosion | You can enable or disable the ability to explode slices. | allowSliceExplosion |
| Changing the exploded state of a slice upon slice click | If you attach an event handler for the sliceClick event, a reference to the clicked slice is supplied in the event arguments and you can modify its exploded state. |
|
You can enable (default setting) or disable slice explosion in the igDoughnutChart.
Note: You must perform all the remaining slice explosion configurations in this topic with slice explosion enabled.
The following table maps the desired behavior to property settings.
| In order to: | Use this property: | And set it to: |
|---|---|---|
| Enable/Disable slice explosion | allowSliceExplosion | true or false |
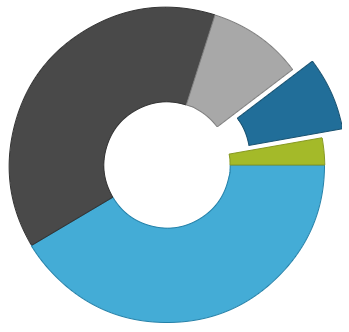
The following screenshot demonstrates an igDoughnutChart with 1 slice exploded.
The igDoughnutChart exposes a sliceClick event used to change whether a slice explodes.
The following table maps the desired behavior to property settings.
| In order to: | Use this event / property: | What to do: |
|---|---|---|
Set the isExploded property |
sliceClick isExploded |
Set the isExploded property to true or false |
The following code example demonstrates how to toggle the explosion state of slices upon click.
In HTML:
<html>
<head>
    …
    $(function () {
        var dc = $("#doughnutChart").igDoughnutChart({
            width: 350,
            height: 350,
            sliceClick: function (event, ui) {
                ui.slice.isExploded = !ui.slice.isExploded;
            },
            series: [
                {
                    …
                }
            ]
           });
    });
    </script>
</head>
<body>
    <!-- Target element for the igDoughnutChart -->
    <div id="doughnutChart"></div>
</body>
</html>
The following samples provide additional information related to this topic.
igDoughnutChart using Ignite UI for MVC. The helper binds to a collection of objects on the server and serializes the collection to JSON objects and renders the required igDoughnutChart HTML and JavaScript.View on GitHub