
This demonstrates how to programmatically enable the column summaries widget of igGrid™ control.
This topic contains the following sections:
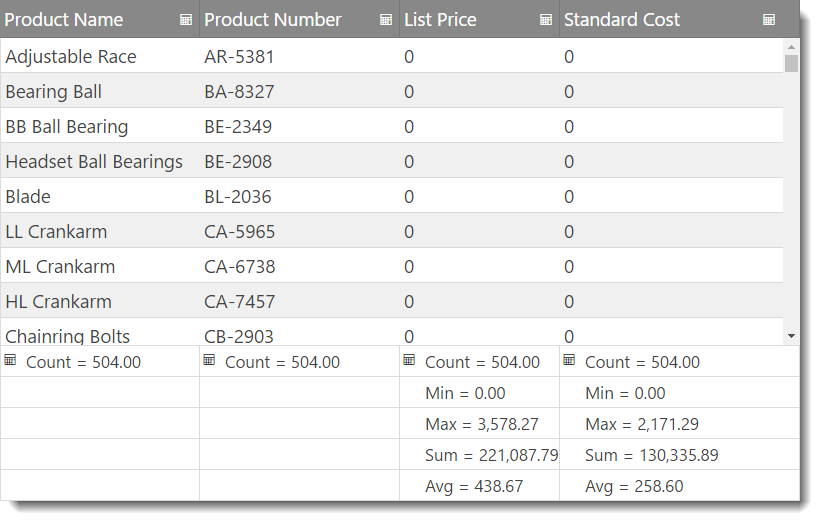
The column summaries widget allows the igGrid to display a summary row for the data in the columns of the grid. There are predefined summary functions, but you can create custom function to calculate custom summaries.
The Column summaries feature of the igGrid control by default, so you need to enable it explicitly.
The example below configures an igGrid with the summaries feature enabled.
Following is a preview of the final result.
jQuery-specific requirements
In HTML:
<table id="grid">
</table>
MVC-specific requirements
The required scripts for both jQuery and MVC sample are the same because both render jQuery widgets. You will need:
The following code sample demonstrates the scripts added to the header section of a HTML file.
In HTML:
<script type="text/javascript" src="jquery.min.js"></script>
<script type="text/javascript" src="jquery-ui.min.js"></script>
<script type="text/javascript" src="infragistics.core.js"></script>
<script type="text/javascript" src="infragistics.lob.js"></script>
For the purpose of this example only:
Set up the data source.
The data source used in the following code snipped is for the purpose of this example.
In HTML:
<script type="text/javascript">
var adventureWorks = [
{ "ProductID": 1, "Name": "Adjustable Race", "ProductNumber": "AR-5381", "StandardCost": 0.0000, "ListPrice": 0.0000 },
{ "ProductID": 2, "Name": "Bearing Ball", "ProductNumber": "BA-8327", "StandardCost": 0.0000, "ListPrice": 0.0000 },
{ "ProductID": 3, "Name": "BB Ball Bearing", "ProductNumber": "BE-2349", "StandardCost": 0.0000, "ListPrice": 0.0000 },
...
]

</script>
Create an igGrid with summaries feature.
Inside the $(document).ready() event handler, you first create an igGrid with summaries feature configuration.
In Javascript:
$("#grid").igGrid({
    autoGenerateColumns: false,
    dataSource: adventureWorks,
    columns: [
                { headerText: "Product Name", key: "Name", dataType: "string", width: "40%" },
                { headerText: "Product Number", key: "ProductNumber", dataType: "string", width: "20%" },
                { headerText: "List Price", key: "ListPrice", dataType: "number", width: "20%" },
                { headerText: "Standard Cost", key: "StandardCost", dataType: "number", width: "20%" }
    ],
    features: [
               {
                 name: 'Summaries'
               }
          ]
});
Save the file.
(Optional) Verify the result.
To verify the result, open the file. The result should look as shown in the Preview above.
Create an MVC Controller method.
Create an MVC Controller method to get data from the Model and will call the View.
In MVC:
public ActionResult Default()
{
    var ds = this.DataRepository.GetDataContext().Products.Take(4);
    return View(ds);
}
Instantiate the igGrid.
Instantiate the igGrid with the columnSummaries feature enabled.
In ASPX:
<%= Html.Infragistics().Grid(Model)
        .AutoGenerateColumns(true)
        .Features(feature =>{
            feature.Summaries();
            }).DataBind()
        .Render()
%>
In Razor:
@( Html.Infragistics().Grid(Model)
        .AutoGenerateColumns(true)
        .Features(feature =>{
            feature.Summaries();
            }).DataBind()
        .Render()
    )
Save the file.
(Optional) Verify the result.
To verify the result, run the MVC project and open the file. The result should look as shown in the Preview above.
The following keyboard interactions are available. When focus is on the grid:
When focus is on the show/hide summaries button in the header of a column:
When focus is on the summaries buttons in the footer of a column:
When focus is on the summaries drop-down:
Following are some other topics you may find useful.
View on GitHub