
This topic explains how to configure the igGrid™ multi-column headers feature.
The following topics are prerequisites to understanding this topic:
igGrid multi-column headers feature.This topic contains the following sections:
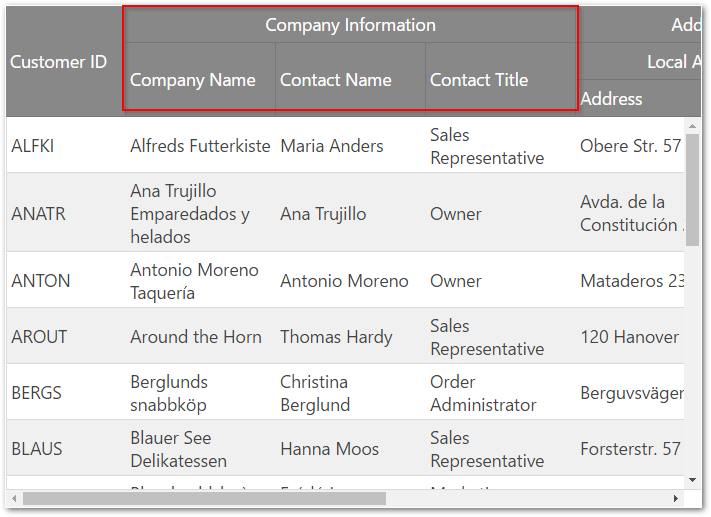
The multi-column headers feature provides header grouping. To accomplish this in the igGrid.options.columns array, there is a new option off of each column object called group. This option can contain an array of other column definitions. The group option is cascading, which means that you can group multi-column headers together. When defining a grouped column you can set the headerText, key and the rowspan properties. The headerText option is used to set the group caption, key is used to reference the column group when used with other features, and rowspan is used to adjust the span of the group header cell. The multi-column headers API is exposed through the grid’s column objects. As with other features, you must add it to the igGrid.options.features array and also reference in the feature’s JavaScript files. In the following screenshot, you see a multi-column header configured for the CompanyName, ContactName and ContactTitle columns.
This procedure guides you through the process of configuring multi-column headers in the igGrid.
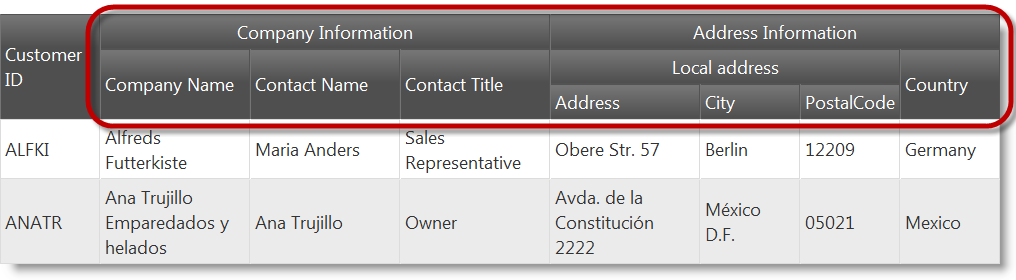
The following screenshot is a preview of the final result.
Following is a conceptual overview of the process:
The following steps demonstrate how to configure multi-column headers in igGrid.
Reference the required JavaScript and CSS files.
The following code snippet is using Infragistics loader to reference Multi-Column Headers feature
In HTML:
 <script src="jquery.min.js" type="text/javascript"></script>
 <script src="jquery-ui.min.js" type="text/javascript"></script>
 <script src="infragistics.loader.js"></script>
In JavaScript:
 <script type="text/javascript">
     $.ig.loader({
         scriptPath: "http://localhost/ig_ui/js/",
         cssPath: "http://localhost/ig_ui/css/",
         resources: "igGrid.MultiColumnHeaders"
     });
 </script>
The following code defines a JavaScript array of objects. This data is used as the igGrid’s data source.
In JavaScript:
 var northwindCustomers = [
 {
     "CustomerID": "ALFKI",
     "CompanyName": "Alfreds Futterkiste",
     "ContactName": "Maria Anders",
     "ContactTitle": "Sales Representative",
     "Address": "Obere Str. 57",
     "City": "Berlin",
     "Region": null,
     "PostalCode": "12209",
     "Country": "Germany",
     "Phone": "030-0074321",
     "Fax": "030-0076545"
 }, {
     "CustomerID": "ANATR",
     "CompanyName": "Ana Trujillo Emparedados y helados",
     "ContactName": "Ana Trujillo",
     "ContactTitle": "Owner",
     "Address": "Avda. de la Constituciu00f3n 2222",
     "City": "Mu00e9xico D.F.",
     "Region": null,
     "PostalCode": "05021",
     "Country": "Mexico",
     "Phone": "(5) 555-4729",
     "Fax": "(5) 555-3745"
 }];
In HTML:
<table id="grid1"></table>
In the following code, there are two groups defined. The first is named “Company Information” and contains CompanyName, ContactName and ContactTitle columns.
The second is called “Address Information” and contains a Country column as well as another group column. The inner group is named “Local address” and contains the Address, City and PostalCode columns.
In JavaScript:
 $.ig.loader(function () {
     $("#grid1").igGrid({
         autoGenerateColumns: false,
         dataSource: northwindCustomers,
         columns: [
             { headerText: "Customer ID", key: "CustomerID", width: "100px" },
             { headerText: "Company Information",
                 group: [
                     { headerText: "Company Name", key: "CompanyName", width: "150px" },
                     { headerText: "Contact Name", key: "ContactName", width: "150px" },
                     { headerText: "Contact Title", key: "ContactTitle", width: "150px" }
                 ]
             },
             { headerText: "Address Information", columnKey: "AddressInformation",
             group: [
                 { headerText: "Local address",
                     group: [
                         { headerText: "Address", key: "Address", width: "150px" },
                         { headerText: "City", key: "City", width: "100px" },
                         { headerText: "PostalCode", key: "PostalCode", width: "100px" }
                     ]
                 },
                 { headerText: "Country", key: "Country", width: "100px" }
             ]}
         ],
         features: [
             {
                 name: 'MultiColumnHeaders'
             }
         ]
     });
 });
This procedure guides you through the process of configuring multi-column headers with collapsible column groups in the igGrid.
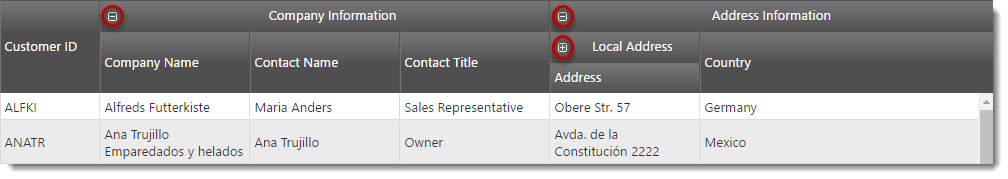
The following screenshot is a preview of the final result.
Following is a conceptual overview of the process:
The following steps demonstrate how to configure multi-column headers with collapsible column groups in igGrid.
Reference the required JavaScript and CSS files.
The following code snippet is using Infragistics loader to reference Multi-Column Headers feature
In HTML:
 <script src="jquery.min.js" type="text/javascript"></script>
 <script src="jquery-ui.min.js" type="text/javascript"></script>
 <script src="infragistics.loader.js"></script>
In JavaScript:
 <script type="text/javascript">
     $.ig.loader({
         scriptPath: "http://localhost/ig_ui/js/",
         cssPath: "http://localhost/ig_ui/css/",
         resources: "igGrid.MultiColumnHeaders"
     });
 </script>
The following code defines a JavaScript array of objects. This data is used as the igGrid’s data source.
In JavaScript:
 var northwindCustomers = [
 {
     "CustomerID": "ALFKI",
     "CompanyName": "Alfreds Futterkiste",
     "ContactName": "Maria Anders",
     "ContactTitle": "Sales Representative",
     "Address": "Obere Str. 57",
     "City": "Berlin",
     "Region": null,
     "PostalCode": "12209",
     "Country": "Germany",
     "Phone": "030-0074321",
     "Fax": "030-0076545"
 }, {
     "CustomerID": "ANATR",
     "CompanyName": "Ana Trujillo Emparedados y helados",
     "ContactName": "Ana Trujillo",
     "ContactTitle": "Owner",
     "Address": "Avda. de la Constituciu00f3n 2222",
     "City": "Mu00e9xico D.F.",
     "Region": null,
     "PostalCode": "05021",
     "Country": "Mexico",
     "Phone": "(5) 555-4729",
     "Fax": "(5) 555-3745"
 }];
In HTML:
<table id="grid1"></table>
In the following code, there are two groups defined. The first is named “Company Information” and contains CompanyName, ContactName and ContactTitle columns.
The second is called “Address Information” and contains Country and Full Address columns as well as another group column. The inner group is named “Local address” and contains the Address, City and PostalCode columns.
The “Company Information” group is collapsible and expanded initially. When it collapses, only the ComapnyName column is visible.
The “Address Information” group is also expanded intitially. When it collapses, an unbounded FullAddress column is shown.
The “Local address” group is initially collapsed with only Address column shown. When expanded, the City and PostalCode columns become visible.
In JavaScript:
 $.ig.loader(function () {
     $("#grid1").igGrid({
         autoGenerateColumns: false,
         dataSource: northwindCustomers,
         columns: [
             { headerText: "Customer ID", key: "CustomerID", dataType: "string", width: "100px" },
             {
                 headerText: "Company Information",
                 group: [
                     {
                         headerText: "Company Name",
                         key: "CompanyName",
                         dataType: "string",
                         width: "150px"
                     },
                     {
                         headerText: "Contact Name",
                         key: "ContactName",
                         dataType: "string",
                         width: "150px",
                         groupOptions: {
                             hidden: "parentcollapsed"
                         }
                     },
                     {
                         headerText: "Contact Title",
                         key: "ContactTitle",
                         dataType: "string",
                         width: "150px",
                         groupOptions: {
                             hidden: "parentcollapsed"
                         }
                     }
                 ],
                 groupOptions: {
                     expanded: true,
                     allowGroupCollapsing: true
                 }
             },
             {
                 headerText: "Address Information",
                 group: [
                     {
                         headerText: "Local Address",
                         group: [
                             {
                                 headerText: "Address",
                                 key: "Address",
                                 dataType: "string",
                                 width: "150px"
                             },
                             {
                                 headerText: "City",
                                 key: "City",
                                 dataType: "string",
                                 width: "100px",
                                 groupOptions: {
                                     hidden: "parentcollapsed"
                                 }
                             },
                             {
                                 headerText: "Postal Code",
                                 key: "PostalCode",
                                 dataType: "string",
                                 width: "100px",
                                 groupOptions: {
                                     hidden: "parentcollapsed"
                                 }
                             }
                         ],
                         groupOptions: {
                             expanded: false,
                             allowGroupCollapsing: true,
                             hidden: "parentcollapsed"
                         }
                     },
                     {
                         headerText: "Country",
                         key: "Country",
                         width: "100px",
                         groupOptions: {
                             hidden: "parentcollapsed"
                         }
                     },
                     {
                         headerText: "Full Address",
                         width: "200px",
                         key: "FullAddress",
                         dataType: "string",
                         unbound: true,
                         formula: function (data, grid) {
                             return data["Address"] + ", " + data["City"];
                         },
                         groupOptions: {
                             hidden: "parentexpanded"
                         }
                     }
                 ],
                 groupOptions: {
                     expanded: true,
                     allowGroupCollapsing: true
                 }
             }
         ],
         features: [
             {
                 name: 'MultiColumnHeaders'
             }
         ]
     });
 });
This procedure guides you through the process of configuring multi-column headers in the igGrid.
The following screenshot is a preview of the final result.
To complete the procedure, you need the following:
Following is a conceptual overview of the process:
The following steps demonstrate how to configure multi-column headers in igGrid.
Reference the required JavaScript and CSS files
In the Index.cshtml View, add the required JavaScript references and instantiate the Infragistics loader.
The following code snippet is using the Infragistics loader to reference the Multi-Column Headers feature
In HTML:
 <script src="jquery.min.js" type="text/javascript"></script>
 <script src="jquery-ui.min.js" type="text/javascript"></script>
 <script src="infragistics.loader.js"></script>
In C#:
 @Html.Infragistics()
 .Loader()
 .ScriptPath("http://localhost/ig_ui/js/")
 .CssPath("http://localhost/ig_ui/css/")
 .Resources("igGrid.MultiColumnHeaders")
 .Render()
Add an ADO.NET Entity Data Model for the Customers table of the Northwind Database and name it NorthwindModel.
Open the Index.cshtml View and add the code below.
In the code there are two groups defined. The first is named “Company Information” and contains the CompanyName, ContactName and ContactTitle columns.
The second group is called “Address Information” and contains a Country column as well as another group column. The inner group is named “Local address” and contains the Address, City and PostalCode columns.
In C#:
 @Html.Infragistics().Grid(Model)
 .AutoGenerateColumns(false)
 .ID("grid1")
 .PrimaryKey("CustomerID")
 .Height("400px")
 .Width("100%")
 .Columns(column =>
 {
     column.For(x => x.CustomerID).HeaderText("Customer ID").Width("100px");
     column.MultiColumnHeader().HeaderText("Company Information").Group(c => {
         c.For(x => x.CompanyName).HeaderText("Company Name").Width("150px");
         c.For(x => x.ContactName).HeaderText("Contact Name").Width("150px");
         c.For(x => x.ContactTitle).HeaderText("Contact Title").Width("150px");
     });
     column.MultiColumnHeader().HeaderText("Address Information").Group(c => {
         c.MultiColumnHeader().HeaderText("Local address").Group(c2 => {
             c2.For(x => x.Address).HeaderText("Address").Width("150px");
             c2.For(x => x.City).HeaderText("City").Width("100px");
             c2.For(x => x.PostalCode).HeaderText("PostalCode").Width("100px");
         });
     });
     column.For(x => x.Country).HeaderText("Country").Width("100px");
 })
 .Features(features => {
     features.MultiColumnHeaders();
 })
 .DataBind().Render()
Note: Column key for multi-column header can be set by passing the key as argument to MultiColumnHeader chaining method. Example: MultiColumnHeader(“companyInformation”)
In the Home controller’s Index action method, extract the Customers data from the Northwind database and return it with the View:
In C#:
 public ActionResult Index()
 {
     var dataContext = new NorthwindDataContext();
     var customers = dataContext.Customers.AsQueryable();
     return View(customers);
 }
This procedure guides you through the process of configuring multi-column headers with collapsible column groups in the igGrid.
The following screenshot is a preview of the final result.
To complete the procedure, you need the following:
Following is a conceptual overview of the process:
The following steps demonstrate how to configure multi-column headers in igGrid.
Reference the required JavaScript and CSS files
In the Index.cshtml View, add the required JavaScript references and instantiate the Infragistics loader.
The following code snippet is using the Infragistics loader to reference the Multi-Column Headers feature
In HTML:
 <script src="jquery.min.js" type="text/javascript"></script>
 <script src="jquery-ui.min.js" type="text/javascript"></script>
 <script src="infragistics.loader.js"></script>
In C#:
 @Html.Infragistics()
 .Loader()
 .ScriptPath("http://localhost/ig_ui/js/")
 .CssPath("http://localhost/ig_ui/css/")
 .Resources("igGrid.MultiColumnHeaders")
 .Render()
Add an ADO.NET Entity Data Model for the Customers table of the Northwind Database and name it NorthwindModel.
Open the Index.cshtml View and add the code below.
In the following code, there are two groups defined. The first is named “Company Information” and contains CompanyName, ContactName and ContactTitle columns.
The second is called “Address Information” and contains Country and Full Address columns as well as another group column. The inner group is named “Local address” and contains the Address, City and PostalCode columns.
The “Company Information” group is collapsible and expanded initially. When it collapses, only the ComapnyName column is visible.
The “Address Information” group is also expanded intitially. When it collapses, an unbounded FullAddress column is shown.
The “Local address” group is initially collapsed with only Address column shown. When expanded, the City and PostalCode columns become visible.
In C#:
 @Html.Infragistics().Grid(Model)
 .AutoGenerateColumns(false)
 .ID("grid1")
 .PrimaryKey("CustomerID")
 .Height("400px")
 .Width("100%")
 .Columns(column =>
 {
     column.For(x => x.CustomerID).HeaderText("Customer ID").Width("100px");
     column.MultiColumnHeader().HeaderText("Company Information")
         .Group(c =>
         {
             c.For(x => x.CompanyName).HeaderText("Company Name").Width("150px");
             c.For(x => x.ContactName).HeaderText("Contact Name").Width("150px")
                 .GroupOptions(go => go.Hidden(CollapsibleGroupHidden.ParentCollapsed));
             c.For(x => x.ContactTitle).HeaderText("Contact Title").Width("150px")
                 .GroupOptions(go => go.Hidden(CollapsibleGroupHidden.ParentCollapsed)); ;
         })
         .GroupOptions(go => go.AllowGroupCollapsing(true).Expanded(true));

     column.MultiColumnHeader().HeaderText("Address Information")
         .Group(c =>
         {
             c.MultiColumnHeader().HeaderText("Local address")
                 .Group(c2 =>
                 {
                     c2.For(x => x.Address).HeaderText("Address").Width("150px");
                     c2.For(x => x.City).HeaderText("City").Width("100px")
                         .GroupOptions(go => go.Hidden(CollapsibleGroupHidden.ParentCollapsed));
                     c2.For(x => x.PostalCode).HeaderText("PostalCode").Width("100px")
                         .GroupOptions(go => go.Hidden(CollapsibleGroupHidden.ParentCollapsed));
                 })
             .GroupOptions(go => go.AllowGroupCollapsing(true).Expanded(false)
             .Hidden(CollapsibleGroupHidden.ParentCollapsed));

             c.For(x => x.Country).HeaderText("Country").Width("100px")
                 .GroupOptions(go => go.Hidden(CollapsibleGroupHidden.ParentCollapsed));
             c.Unbound("FullAddress").HeaderText("Full Address").Width("200px").Formula("fullAddressFormula")
                 .GroupOptions(go => go.Hidden(CollapsibleGroupHidden.ParentExpanded));
         })
         .GroupOptions(go => go.AllowGroupCollapsing(true).Expanded(true));

 })
 .Features(features => {
     features.MultiColumnHeaders();
 })
 .DataBind().Render()
Note: Column key for multi-column header can be set by passing the key as argument to MultiColumnHeader chaining method. Example: MultiColumnHeader(“companyInformation”)
In the Home controller’s Index action method, extract the Customers data from the Northwind database and return it with the View:
In C#:
 public ActionResult Index()
 {
     var dataContext = new NorthwindDataContext();
     var customers = dataContext.Customers.AsQueryable();
     return View(customers);
 }
The following topics provide additional information related to this topic.
igGrid features.The following sample provides additional information related to this topic.
View on GitHub