
This topic demonstrates how to add a worksheet chart to an Excel® worksheet (".xlsx) programmatically, using the Javascript Excel Library to show visual representations of data trends across regions of cells in a worksheet.
This topic contains the following sections:
NOTE: The XLSX format is required. Other formats are not supported at this time.
You need to first read the following topics:
In order to add a chart to a worksheet, you must use the addChart method of the worksheet's Shapes collection. In this method, you can specify the chart type that you wish to use, and then either the area in twips or the top-left cell and bottom-right cell, depending on the overload of this method that you choose to use.
The addChart method returns the worksheet chart element to be added to the worksheet. Once you have this, you can use the setSourceData method on the chart to set a cell address of the region of worksheet cells that you wish to use as a data source, as well as whether or not you want to switch the mapping of columns and rows to the X and Y axis.
There are over 70 supported chart types including, Line, Area, Column, and Pie. To see the full list, see the Worksheet ChartType API topic.
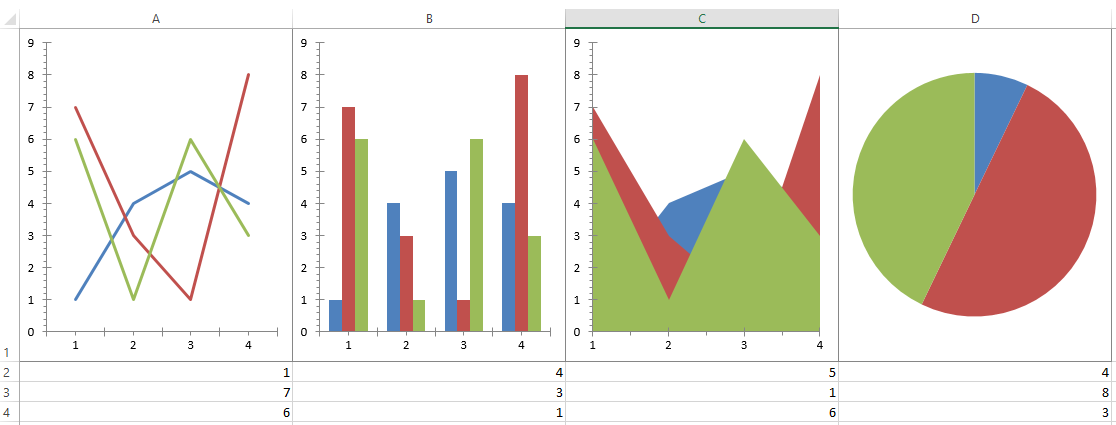
The following is a preview of the final result of a worksheet with a Line, Column, Area and Pie chart displayed, along with the data used for each using the code snippets below:
In JavaScript:
$(function () {

    //Create workbook with a worksheet to place the charts in. Data is assumed to already exist in the screenshot above.
    var workbook = new $.ig.excel.Workbook($.ig.excel.WorkbookFormat.excel2007);
    var sheet = workbook.worksheets().add("Sheet1");

    //Set column widths and height of first row to show the charts more clearly.
    sheet.defaultColumnWidth(10000);
    sheet.rows(0).height(5000);

    //Get the four cells that will be used to place the four charts below.
    var cell1 = sheet.getCell("A1");
    var cell2 = sheet.getCell("B1");
    var cell3 = sheet.getCell("C1");
    var cell4 = sheet.getCell("D1");

    //Create Line chart.
    var chart1 = sheet.shapes().addChart($ig.excel.ChartType.line, cell1, { x: 0, y: 0 }, cell1, { x: 100, y: 100 });
    chart1.setSourceData('Sheet1!A2:D4', true);

    //Create Column chart.
    var chart2 = sheet.shapes().addChart($ig.excel.ChartType.columnClustered, cell2, { x: 0, y: 0 }, cell2, { x: 100, y: 100 });
    chart2.setSourceData('Sheet1!A2:D4', true);

    //Create Area chart.
    var chart3 = sheet.shapes().addChart($ig.excel.ChartType.area, cell3, { x: 0, y: 0 }, cell3, { x: 100, y: 100 });
    chart3.setSourceData('Sheet1!A2:D4', true);

    //Create Pie chart.
    var chart4 = sheet.shapes().addChart($ig.excel.ChartType.pie, cell4, { x: 0, y: 0 }, cell4, { x: 100, y: 100 });
    chart4.setSourceData('Sheet1!A2:D4', false);
});
View on GitHub