
The igShapeChart is a lightweight, highly performant chart. This chart can be easily configured to display scatter as well as providing support for two additional data visualizations (Polyline and Polygon). The chart can also plot data from shape files or any custom shape that you can define using an array of arrays of X/Y points.
The chart is using a smart Data Adapter to analyze your data and render with the appropriate visualization. For example, if the chartType is set to Auto and the data set consists of a List of List of points, then a point chart, a polyline chart, or a polygon chart will be plotted.
However, you can also explicitly specify the chart type by setting the chartType property to one of nine supported visualizations:
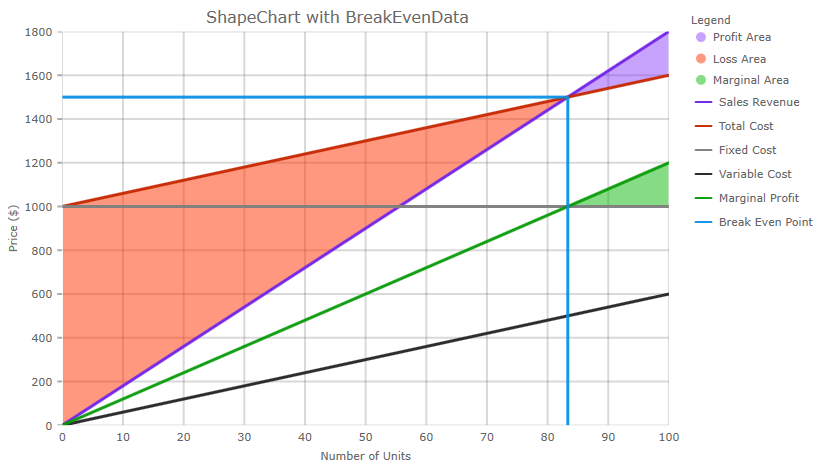
In addition, the Shape Chart can render break-even data as long as at least one data item has FixedCost, VariableCost, SalesRevenue, and SalesUnits data columns.
Related topics:
View on GitHub