
This topic explains using a code example how to add the igShapeChart control to your application.
This topic contains the following sections:
The following procedure demonstrates adding the igShapeChart to your applications.
The following is a screenshot of the igShapeChart:
The following procedure takes you through the steps necessary for adding the igShapeChart to a page.
Create a target element for storing the igShapeChart
Create a
In HTML:
<body>
    <div id="shapeChart"></div>
</body>
Add a data source
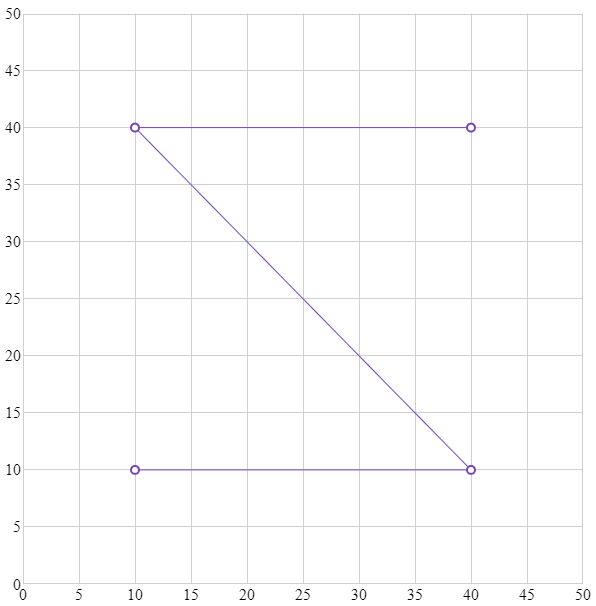
In order to create an igShapeChart, you must first have data to bind it to. The following code snippet demonstrates how to create a simple data source.
In HTML:
<script>
    var data = [
    { "X": 10, "Y": 10 },
    { "X": 40, "Y": 10 },
    { "X": 10, "Y": 40 },
    { "X": 40, "Y": 40 }];
</script>
Instantiate the igShapeChart and bind the data source
Use the selector of the target
In HTML:
<script>
    $(function () {
        $("#shapeChart").igShapeChart({
            dataSource: data,
            width: "600px",
            height: "600px",
            xAxisMinimumValue: 0,
            yAxisMinimumValue: 0,
            xAxisMaximumValue: 50,
            yAxisMaximumValue: 50,
        });
    });
</script>
Verify the result
Build and run your project to verify the result. If you have implemented the above steps correctly, the displayed igShapeChart should look like the one in the Preview section above.
View on GitHub