
This topic explains, with code examples, how to bind the igShapeChart control to shape file data.
The following topics are prerequisites to understanding this topic:
The igShapeChart control has the ability to bind and display shape files. This is useful if you would like to visualize shape data. For example, if you wanted to visualize geographic data, like in the code examples below, or if you wanted to view something like a seating chart for a particular venue, the igShapeChart can help you to achieve this.
You can do this by either binding the dataSource property of the igShapeChart to an array of ShapeDataSource records, or by binding the databaseSource and shapeDataSource properties of the chart. Which you choose to do really depends on whether you are binding a single or multiple shape files at a time. This is explained further in the code examples below.
It is important also to note that you will require both a web hosted .shp and .dbf file in order to do this.
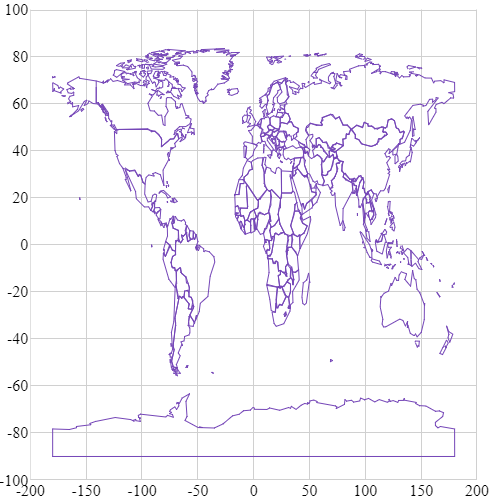
In order to bind a single shape file, you can set the databaseSource and shapeDataSource properties to the URL pointing at the .dbf and .shp files, respectively.
The following code example demonstrates how this can be achieved.
In HTML:
<script>
    $(function () {
        $("#shapeChart").igShapeChart({
            width: "500px",
            height: "500px",
            databaseSource: 'https://www.igniteui.com/data-files/shapes/world_countries_reg.dbf',
            shapeDataSource: 'https://www.igniteui.com/data-files/shapes/world_countries_reg.shp'
        });
    });
</script>
Following the steps above will result in an igShapeChart control that looks like the following:
The igShapeChart does not currently have support for binding an array of URLs, but it does still have support for displaying multiple shape files at once. As such, you will need to create a ShapeDataSource element for each of your .shp and .dbf pairs that you are looking to bind, and then bind the dataSource property of the igShapeChart to an array of these ShapeDataSource's records.
The ShapeDataSource's records will be loaded asynchronously, and so you may want to utilize the callback function of the ShapeDataSource along with a boolean flag variable for each to synchronize when all of your ShapeDataSources are ready. At this point, you should initialize and set the dataSource of your igShapeChart.
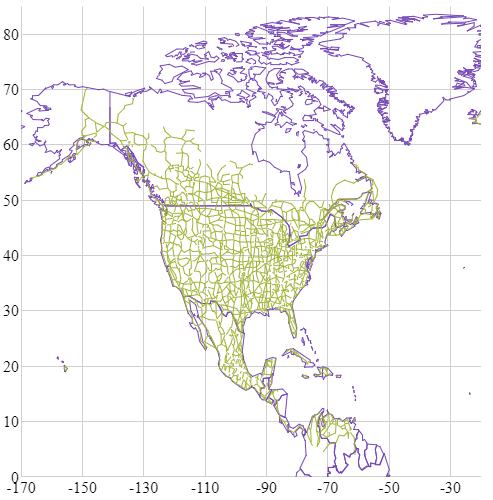
The following code example demonstrates how you can bind the igShapeChart to a pair of ShapeDataSources, showing an outline of North America along with a depiction of the major roads on the continent.
In HTML:
<script>

    var ds1Ready = false;
    var ds2Ready = false;
    var ds1 = null;
    var ds2 = null;

    function checkReady() {
        if (ds1Ready && ds2Ready) {
            var arr = [
                ds1.converter().records(),
                ds2.converter().records()
            ];

            $("#shapeChart").igShapeChart({
                width: "500px",
                height: "500px",
                xAxisMinimumValue: -170,
                xAxisMaximumValue: -20,
                yAxisMaximumValue: 85,
                yAxisMinimumValue: 0,
                dataSource: arr
            });
        }
    }

    $(function () {
        ds1 = new $.ig.ShapeDataSource({
            shapefileSource: "https://www.igniteui.com/data-files/shapes/world_countries_reg.shp",
            databaseSource: "https://www.igniteui.com/data-files/shapes/world_countries_reg.dbf",
            callback: function() {
                ds1Ready = true;
                checkReady();
            }
        }).dataBind();

        ds2 = new $.ig.ShapeDataSource({
            shapefileSource: "https://www.igniteui.com/data-files/shapes/north_america_primary_roads.shp",
            databaseSource: "https://www.igniteui.com/data-files/shapes/north_america_primary_roads.dbf",
            callback: function() {
                ds2Ready = true;
                checkReady();
            }
        }).dataBind();

    });

</script>
Following the steps above will result in an igShapeChart that looks like the following:
The following samples provide additional information related to this topic.
igShapeChart control binding to a single shape file.igShapeChart control binding to multiple shape files.View on GitHub