
This topic explains, with a code example, how to add a legend to the igShapeChart control.
The following topics are prerequisites to understanding this topic:
The igShapeChart control has support for showing legends, but does not currently display legends for any series in the chart by default. In order to show a common legend for your shape chart, you need to set the legend option on the chart.
The legend element that will be created, will pull the names of its items from the Title property of the series that are plotted in the chart, and it will show your series' names in the format of "Series Type (XMemberPath vs YMemberPath)" by default. You can format the name shown in the Legend by utilizing the SeriesAdded event. The event arguments of this event can net you the series that has been added, allowing you to modify the Title of that series accordingly.
The following is a preview of what the igShapeChart will look like when following the code example given below:
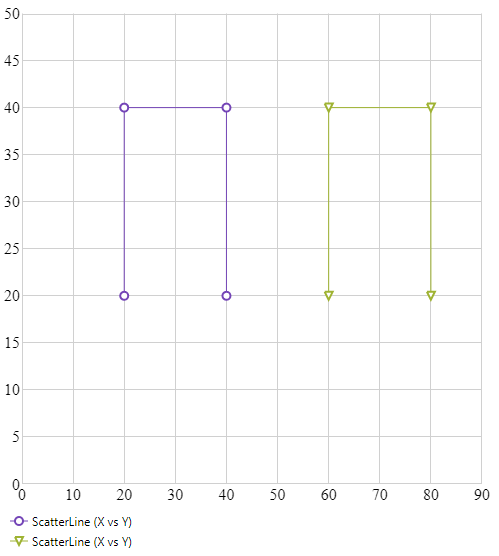
The following code example shows how to use a legend for multiple series plotted within the igShapeChart control.
In HTML:
<div id="shapeChart"></div>
<div id="legend"></div>

<script>
    var list1 = [
    { "X": 20, "Y": 20 },
    { "X": 20, "Y": 40 },
    { "X": 40, "Y": 40 },
    { "X": 40, "Y": 20 }];

    var list2 = [
    { "X": 60, "Y": 20 },
    { "X": 60, "Y": 40 },
    { "X": 80, "Y": 40 },
    { "X": 80, "Y": 20 }];

    var data = [[list1], [list2]];

    $(function () {
        $("#shapeChart").igShapeChart({
            dataSource: data,
            width: "500px",
            height: "500px",
            xAxisMinimumValue: 0,
            yAxisMinimumValue: 0,
            xAxisMaximumValue: 90,
            yAxisMaximumValue: 50,
            legend: { element: "legend", type: "legend" },
        });
    });
</script>
The following sample provides additional information related to this topic.
igShapeChart control.View on GitHub