
This topic explains, with a code example, how to bind break-even data in the igShapeChart control.
The following topics are prerequisites to understanding this topic:
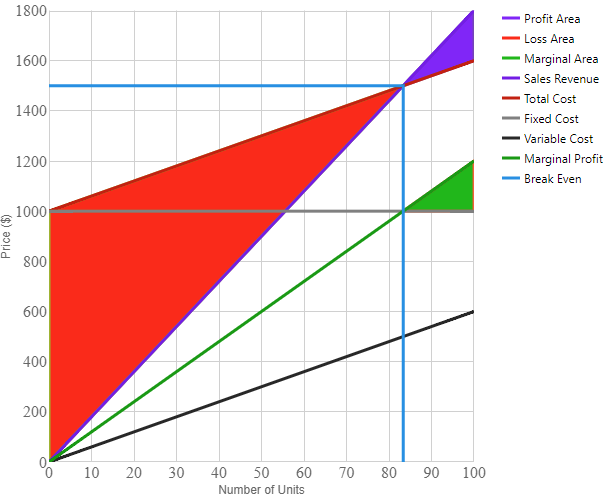
The igShapeChart control has support for displaying "break-even" data. In order to do this, you will need to have at least a single data item with four numeric properties named FixedCost, VariableCost, Revenue, and Units. You can also optionally add a numeric property named MarginalProfit in order to plot that as well. For example, this would allow you to view a financial visualization of the break-even point given a number of units sold when bought for a particular price and sold for a particular price.
Once plotted, the igShapeChart control will create a view with the Revenue property on the Y-Axis and the Units property on the X-Axis to generate a linear financial view of the relation between the two. This includes a series for each of the required properties mentioned above.
Also generated will be a linear view of the Total Cost, Break Even point, and optionally the Marginal Profit, along with an area view of the Profit Area, Loss Area, and optionally, the Marginal Area as well.
The following is a preview of what the igShapeChart will look like when following the code example given below:
The following code example shows how to bind break-even data to the igShapeChart control.
In HTML:
<body>

    <div id="shapeChart"></div>
    <div id="legend"></div>

    <script>

        var data = [
        {
            "Units": 100, "Revenue": 1800, "VariableCost": 600, "FixedCost": 1000,
        }];

        $(function () {
            $("#shapeChart").igShapeChart({
                dataSource: data,
                thickness: 3,
                width: "500px",
                height: "500px",
                yAxisTitle: "Price ($)",
                xAxisTitle: "Number of Units",
                brushes: ["#7F2AFA", "#FF3100", "#02B602", "#7222E7", "#C62600", "#808080", "#282828", "#029802", "#078FE4"],
                legend: $("#legend")
            });

            $("#legend").igChartLegend({});
        });

    </script>

</body>
The following sample provides additional information related to this topic.
igShapeChart control binding to break-even data.View on GitHub