
The topics in this group explain both the Polygon and Polyline series. These series can be used to display custom shapes in the igDataChart. All that is required is providing both series with a list of points made up of X and Y values. These points are what define the shape.
Figure 1. Scatter Polygon Series
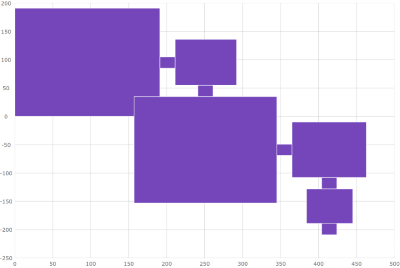
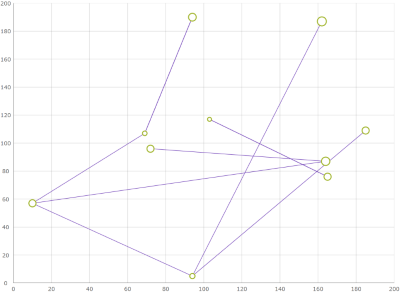
Figure 2. Scatter Polyline Series
Configuring the Scatter Polygon Series (igDataChart): This topic provides information about the polygon series. It describes the properties of the polygon series and provides an implementation example.
Configuring the Scatter Polyline Series (igDataChart): This topic provides information about the polyline series. It describes the properties of the polyline series and provides an implementation example.
View on GitHub