
This topic provides information on how to use the scatter polyline series element in the igDataChart control.
You should be familiar with the following topics before continuing:
Adding igDataChart: This topic demonstrates how to add the igDataChart™ control to a page and bind it to data.
Binding igDataChart to Data: This topic explains how to bind the igDataChart™ control to various data sources (JavaScript array, IQueryable<T>, web service).
This topic contains the following sections:
In the igDataChart control, the scatter polyline series is a series that displays data using polylines. This type of scatter series is often used where rendering disconnected lines are required such as a network graph. The scatter polyline series works a lot like the scatter polygon series except that data is rendered with polylines instead of polygons.
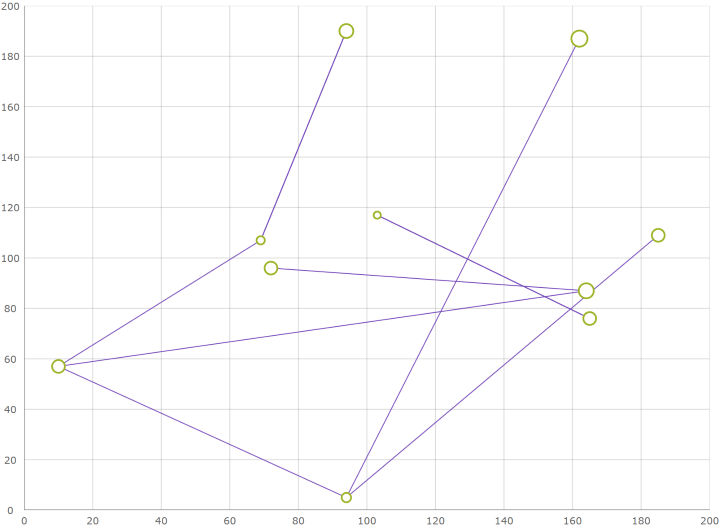
The following is a preview of the igDataChart control with the scatter polyline series rendering connections between various points.
Similar to other types of series in the igDataChart control, the scatter polyline series has the dataSource option for the purpose of data binding. This option is provided as an array of items where each item must have one data column that stores point locations (X and Y values) of a shape as another array. This data column is mapped to the shapeMemberPath option. The scatter polyline series uses points of this mapped data column to plot polylines in the igDataChart control.
Based on the above data requirements, an example of how your data must be structured is as follows:
In JavaScript:
var data = [
    { Points: [
        [{x: 0, y: 0}, {x: 0.5, y: 1}, {x: -0.5, y:1}, {x: 0, y: 0}],
        [{x: 2, y: 0}, {x: 2.5, y: 1}, {x: 1.5, y:1}, {x: 2, y: 0}]]}]
Once your data is ready you can provide it to the chart:
In JavaScript:
$("#chart").igDataChart({
    width: "400px",
    height: "400px",
    axes: [{
        name: "xAxis",
        type: "numericX",
    }, {
        name: "yAxis",
        type: "numericY",
    }],
    series: [{
        name: "series1",
        type: "scatterPolyline",
        dataSource: data,
        xAxis: "xAxis",
        yAxis: "yAxis",
        shapeMemberPath: "Points",
    }],
});
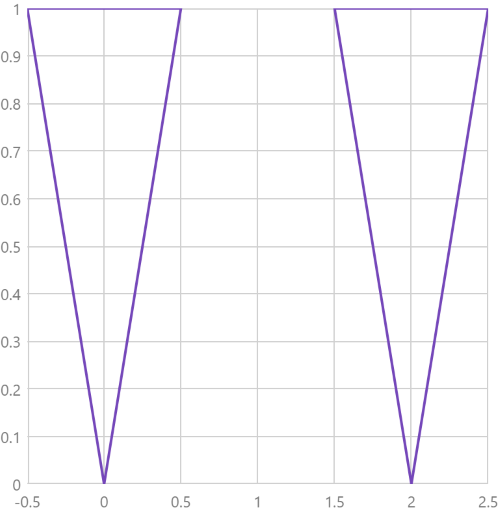
With the above data and chart, the following result is generated:
Configuring Shape Series: This topic provides an overview of the scatter polygon and polyline series for the igDataChart control.
Configuring the Scatter Polygon Series: This topic explains how to configure the scatter polygon series for the igDataChart control.
igDataChart control.View on GitHub