
This topic explains how to add the igDoughnutChart™ to an HTML page.
The following topics are prerequisites to understanding this topic:
Adding Required Resources Manually: This topic provides general guidance on adding required JavaScript resources to use controls from the Ignite UI for jQuery library.
igDoughnutChart Overview: This topic provides an overall look at the igDoughnutChart control.
This topic contains the following sections:
Use the Doughnut Chart to show categorical statistics expressed in percentages. Consisting of a hollowed out circle, the inner radius of which is configurable, and using concentric rings the Doughnut Chart is able to display multiple series. Styling the chart is possible by configuring its properties or applying themes.
The following table summarizes the requirements for using the igDoughnutChart control.
| Required Resources | Description | What you need to do… | ||||||||||||||||||||||||||||||||
|---|---|---|---|---|---|---|---|---|---|---|---|---|---|---|---|---|---|---|---|---|---|---|---|---|---|---|---|---|---|---|---|---|---|---|
| jQuery and jQuery UI JavaScript resources | Ignite UI for jQuery™ is built on top of the following frameworks: |
Add script references to both libraries in the <head> section of your page.
|
||||||||||||||||||||||||||||||||
| igDoughnutChart CSS resource files |
Uses the styles from the following CSS file for rendering various elements of the control: <IG CSS root>/structure/modules/infragistics.ui.html5.css <IG CSS root>/structure/modules/infragistics.ui.shared.css <IG CSS root>/structure/modules/infragistics.ui.chart.css |
|||||||||||||||||||||||||||||||||
General igDoughnutChart JavaScript Resources
|
The igDoughnutChart control depends on functionality distributed across several files in the Ignite UI for jQuery Library. Load the required resources in one of the following ways:
|
Add one of the following:
|
||||||||||||||||||||||||||||||||
| IG Theme(Optional) | This theme contains the visual styles for the Ignite UI for jQuery library. The theme file is:<IG CSS root>/themes/Infragistics/infragistics.theme.css |
Following are the general conceptual steps for Adding igDoughnutChart to an HTML Page.
igDoughnutChart target elementigDoughnutChart in document readyThis procedure adds an instance of igDoughnutChart to an HTML page configures the control’s basic options- dimensions and defines one series with a name, dataSource and valueMemberPath.
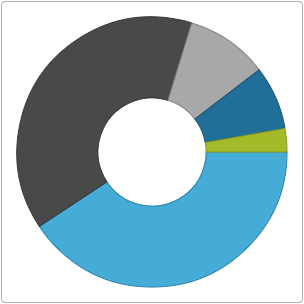
The following screenshot is a preview of the result.
A blank HTML page.
igDoughnutChartigDoughnutChart in document readyFollow these steps to add an igDoughnutChart to an HTML page.
Reference the required JavaScript and CSS files
In HTML:
 <!DOCTYPE html>
 <html>
 <head>
 <!-- Ignite UI for jQuery IG Theme CSS File -->
 <link href="../../igniteui/css/themes/infragistics/infragistics.theme.css" rel="stylesheet" />
 <!-- Ignite UI for jQuery Required CSS File -->
 <link rel="stylesheet" type="text/css" href="../../igniteui/css/structure/modules/infragistics.ui.html5.css"/>
 <link rel="stylesheet" type="text/css" href="../../igniteui/css/structure/modules/infragistics.ui.shared.css"/>
 <link rel="stylesheet" type="text/css" href="../../igniteui/css/structure/modules/infragistics.ui.chart.css"/>
 <!-- jQuery Files -->
 <script src="../../js/jquery.min.js"></script>
 <script src="../../js/jquery-ui.min.js"></script>
 <!-- Ignite UI for jQuery Required JavaScript Files -->
 <script src="../../igniteui/js/modules/infragistics.util.js" type="text/javascript"></script>
 <script src="../../igniteui/js/modules/infragistics.util.jquery.js" type="text/javascript"></script>
 <script src="../../igniteui/js/modules/infragistics.ui.widget.js" type="text/javascript"></script>
 <script src="../../igniteui/js/modules/infragistics.datasource.js" type="text/javascript"></script>
 <script src="../../igniteui/js/modules/infragistics.templating.js" type="text/javascript"></script>
 <script src="../../igniteui/js/modules/infragistics.ext_core.js" type="text/javascript"></script>
 <script src="../../igniteui/js/modules/infragistics.ext_collections.js" type="text/javascript"></script>
 <script src="../../igniteui/js/modules/infragistics.ext_ui.js" type="text/javascript"></script>
 <script src="../../igniteui/js/modules/infragistics.dv_jquerydom.js" type="text/javascript"></script>
 <script src="../../igniteui/js/modules/infragistics.dv_core.js" type="text/javascript"></script>
 <script src="../../igniteui/js/modules/infragistics.legend.js" type="text/javascript"></script>
 <script src="../../igniteui/js/modules/infragistics.dv_geometry.js" type="text/javascript"></script>
 <script src="../../igniteui/js/modules/infragistics.dv_interactivity.js" type="text/javascript"></script>
 <script src="../../igniteui/js/modules/infragistics.datachart_core.js" type="text/javascript"></script>
 <script src="../../igniteui/js/modules/infragistics.dvcommonwidget.js" type="text/javascript"></script>
 <script src="../../igniteui/js/modules/infragistics.ui.chartlegend.js" type="text/javascript"></script>
 <script src="../../igniteui/js/modules/infragistics.ui.chart.js" type="text/javascript"></script>
 <script src="../../igniteui/js/modules/infragistics.piechart.js" type="text/javascript"></script>
 <script src="../../igniteui/js/modules/infragistics.doughnutchart.js" type="text/javascript"></script>
 <script src="../../igniteui/js/modules/infragistics.ui.basechart.js" type="text/javascript"></script>
 <script src="../../igniteui/js/modules/infragistics.ui.doughnutchart.js" type="text/javascript"></script>
 </head>
 <body>
 </body>
 </html>
Add sample data
Define a JavaScript array with sample data as a data source for the series of igDoughnutChart.
In HTML:
 <head>...
     <script>
         var data = [
               { "ProductCategory": ' Footwear', "Index": 1498 },
                 { "ProductCategory": ' Clothing', "Index": 1389 },
                 { "ProductCategory": ' Books', "Index": 352 },
                 { "ProductCategory": ' Accessories', "Index": 273 },
                 { "ProductCategory": ' Equipment', "Index": 100 }
             ];
              ...
        </script>
  </head>
Create a target element for the igDoughnutChart.
Create a DIV element within the HTML body on which to instantiate the igDoughnutChart widget.
In HTML:
 <body>
     <!-- Target element for the igDoughnutChart -->
     <div id="doughnutChart"></div>
 </body>
 …
Instantiate the igDoughnutChart in document ready
Use the selector of the target element, defined previously, to instantiate the widget.
In HTML:
 <script type="text/jscript">
     $(function () {
               $("#doughnutChart").igDoughnutChart ({
         });
         });
 </script>
Configure basic rendering options
When instantiating the igDoughnutChart, configure its width and height options and add a series to it with the following options provided: name, dataSource and valueMemberPath.
In HTML:
 $(function () {
             var dc = $("#doughnutChart").igDoughnutChart({
               width: 300,
               height: 300,
               series: [
             {
                   name: "flatSeries",
                   valueMemberPath: "Index",
                   dataSource: data
               }
         ]
    });
 });
In HTML:
<!DOCTYPE html>
<html>
<head>
<title>DoughnutChart</title>
    <!-- Ignite UI for jQuery IG Theme CSS File -->
    <link href="../../igniteui/css/themes/infragistics/infragistics.theme.css" rel="stylesheet" />
    <!-- Ignite UI for jQuery Required CSS File -->
    <link rel="stylesheet" type="text/css" href="../../igniteui/css/structure/modules/infragistics.ui.html5.css"/>
    <link rel="stylesheet" type="text/css" href="../../igniteui/css/structure/modules/infragistics.ui.shared.css"/>
    <link rel="stylesheet" type="text/css" href="../../igniteui/css/structure/modules/infragistics.ui.chart.css"/>
    <!-- jQuery Files -->
    <script src="../../js/jquery.min.js"></script>
    <script src="../../js/jquery-ui.min.js"></script>
    <!-- Ignite UI for jQuery Required JavaScript Files -->
    <script src="../../igniteui/js/modules/infragistics.util.js" type="text/javascript"></script>
    <script src="../../igniteui/js/modules/infragistics.util.jquery.js" type="text/javascript"></script>
    <script src="../../igniteui/js/modules/infragistics.ui.widget.js" type="text/javascript"></script>
    <script src="../../igniteui/js/modules/infragistics.datasource.js" type="text/javascript"></script>
    <script src="../../igniteui/js/modules/infragistics.templating.js" type="text/javascript"></script>
    <script src="../../igniteui/js/modules/infragistics.ext_core.js" type="text/javascript"></script>
    <script src="../../igniteui/js/modules/infragistics.ext_collections.js" type="text/javascript"></script>
    <script src="../../igniteui/js/modules/infragistics.ext_ui.js" type="text/javascript"></script>
    <script src="../../igniteui/js/modules/infragistics.dv_jquerydom.js" type="text/javascript"></script>
    <script src="../../igniteui/js/modules/infragistics.dv_core.js" type="text/javascript"></script>
    <script src="../../igniteui/js/modules/infragistics.legend.js" type="text/javascript"></script>
    <script src="../../igniteui/js/modules/infragistics.dv_geometry.js" type="text/javascript"></script>
    <script src="../../igniteui/js/modules/infragistics.datachart_core.js" type="text/javascript"></script>
    <script src="../../igniteui/js/modules/infragistics.dvcommonwidget.js" type="text/javascript"></script>
    <script src="../../igniteui/js/modules/infragistics.ui.chartlegend.js" type="text/javascript"></script>
    <script src="../../igniteui/js/modules/infragistics.ui.chart.js" type="text/javascript"></script>
    <script src="../../igniteui/js/modules/infragistics.piechart.js" type="text/javascript"></script>
    <script src="../../igniteui/js/modules/infragistics.doughnutchart.js" type="text/javascript"></script>
    <script src="../../igniteui/js/modules/infragistics.ui.basechart.js" type="text/javascript"></script>
    <script src="../../igniteui/js/modules/infragistics.ui.doughnutchart.js" type="text/javascript"></script>
    <script type="text/javascript">
            var data = [
            { "ProductCategory": ' Footwear', "Index": 1498 },
                { "ProductCategory": ' Clothing', "Index": 1389 },
                { "ProductCategory": ' Books', "Index": 352 },
                { "ProductCategory": ' Accessories', "Index": 273 },
                { "ProductCategory": ' Equipment', "Index": 100 }];
                  $(function () {
            var dc = $("#doughnutChart").igDoughnutChart({
                    width: 300,
                    height: 300,
                    series: [
                          {
                                    name: "flatSeries",
                                valueMemberPath: "Index",
                                    dataSource: data
                          }
                    ]
            });
        });
    </script>
</head>
<body>
<!-- Target element for the igDoughnutChart -->
<div id="doughnutChart"></div>
</body>
</html>
The following topics provide additional information related to this topic.
Adding igDoughnutChart to an ASP.NET MVC Application: This topic walks through instantiating an igDoughnutChart in an ASP.NET MVC application using Ignite UI for MVC.
jQuery and MVC API Links (igDoughnutChart): This topic provides links to the API documentation about the igDoughnutChart control and the Ignite UI for MVC for it.
The following sample provides additional information related to this topic.
View on GitHub