
This topic explains how to configure the visual features and behavior of the igFunnelChart™ control.
The following topics are prerequisites to understanding this topic:
igFunnelChart Overview: This topic provides conceptual information about the igFunnelChart control including its main features, minimum requirements, and user functionality.
Adding igFunnelChart: This topic demonstrates how to add the igFunnelChart control to an HTML page and bind it to data.
This topic contains the following sections:
The purpose of the igFunnelChart control is to display values for a set of categories representing some aspect (for example, total inventory for categories of products or population for age groups in a country).
The configurable aspects of the igFunnelChart control are:
Each of these aspects is explained in the configuration summary chart below.
The following table lists the configurable aspects of the igFunnelChart control.
| Configurable aspect | Details | JavaScript properties | ASP.NET MVC properties |
|---|---|---|---|
| Funnel's direction | By default, the chart is rendered with the items listed in descending order based on their values value (highest value on top, lowest value at bottom). igFunnelChart can be configured to display slices in reverse order. | ||
| Slices' weight | By default, the funnel chart renders slices of varying height depending on their values. You can configure the heights to be uniform. | ||
| Funnel's shape | igFunnelChart renders a shape based on either straight line or Bezier curve. If enabled, Bezier curved shapes require you to set the coordinates of the Bezier control points. By default, the chart is rendered with straight line. | ||
| Slice selection | Slice selection is the capability for selecting individual slices. When a slice is selected, a corresponding event is fired. By default, slice selection is disabled. | ||
| Label visibility | igFunnelChart renders labels inside slices (inner) and outside of (outer) slices and provides individual visibility control for both labels. By default, if the path of the inner label is defined, then the label will be visible. This is not valid for the outer label, even if its path has been defined. | ||
| Outer label alignment | You can position the outer labels on either the left or right side of the funnel chart. By default, the labels are positioned on the left of the funnel chart. | ||
| Tooltip look-and-feel | You can define a template for rendering tooltips on the page. By default, there is no tooltip template define, so no tooltips are displayed. | ||
| Animation speed | You can configure the speed at which igFunnelChart renders animation when visual elements of the funnel chart change. By default, the duration of the animation is 0 ms which means that animation is disabled. |
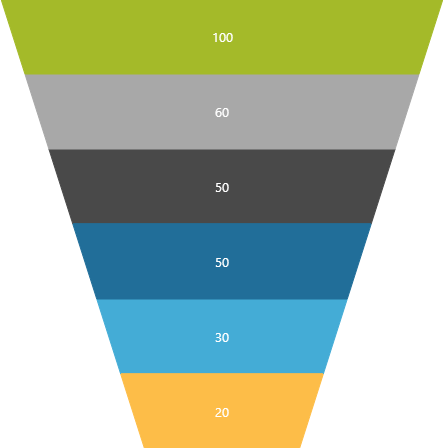
With its default settings, the igFunnelChart control renders a funnel chart with:
and without:
The following picture demonstrates a funnel chart rendered with these default settings of the igFunnelChart control
For the chart to render properly, you need to configure the igFunnelChart control to have:
Though it is not a technical requirement, for the chart to make sense to users, you need to define also:
The following table lists the code examples included in this topic.
| Example | Description |
|---|---|
| Configuring an Inverted Funnel Chart | This example demonstrates how to configure an igFunnelChart control to render an inverted funnel. |
| Configuring Weighted Slices | This example demonstrates how to configure an igFunnelChart control to render weighted slices. |
| Configuring a Bezier-Curve Funnel Chart | This example demonstrates how to configure an igFunnelChart control to use Bezier curve shape. |
| Enabling Slice Selection | This example demonstrates how to enable the slice selection feature of igFunnelChart and how to respond to slice clicked events. |
This code example shows how to configure an igFunnelChart control to display an inverted funnel. A normal funnel chart displays the largest slice at the top and the smallest at the bottom of the funnel while an Inverted funnel chart displays the smallest slice at the top and the largest at the bottom.
Following is the code that implements this example.
In JavaScript:
$("#chartInverted").igFunnelChart({
    width: "325px",
    height: "450px",
    dataSource: data,
    valueMemberPath: "Budget",
    innerLabelMemberPath: "Budget",
    innerLabelVisibility: "visible",
    outerLabelMemberPath: "Department",
    outerLabelVisibility: "visible",
    isInverted: true
});
This code example shows how to configure an igFunnelChart control to render weighted slices. Normally funnel charts render with slices of equal height while Weighted slices render with different height depending on their value.
Following is the code that implements this example.
In JavaScript:
$("#chartWeighted").igFunnelChart({
    width: "325px",
    height: "450px",
    dataSource: data,
    valueMemberPath: "Budget",
    innerLabelMemberPath: "Budget",
    innerLabelVisibility: "visible",
    outerLabelMemberPath: "Department",
    outerLabelVisibility: "visible",
    funnelSliceDisplay: "weighted"
});
This code example shows how to configure an igFunnelChart control to use Bezier curve shape.
To enable the Bezier Curve feature, use the useBezierCurve option. The bezierPoints option configures the coordinates of the upper and lower Bezier control points, which determine the shape of the funnel chart. The string passed to the option must contain four numbers between 0 and 1 separated by a space. Define the x- and y-coordinates of the upper control point with the first and the second numbers, respectively and define the x- and y-coordinates of the lower control point with the third and the fourth numbers, respectively.
Following is the code that implements this example.
In JavaScript:
$("#chartBezier").igFunnelChart({
    width: "325px",
    height: "450px",
    dataSource: data,
    valueMemberPath: "Budget",
    innerLabelMemberPath: "Budget",
    innerLabelVisibility: "visible",
    outerLabelMemberPath: "Department",
    outerLabelVisibility: "visible",
    useBezierCurve: true,
    bezierPoints: "0.1 0.1 0.7 1"
});
This code example shows how to enable the slice selection feature of igFunnelChart and how to respond to “slice clicked” events. Enabling slice selection raises a sliceClicked event with every click on a slice.
Enable slice selection by setting the allowSliceSelection option to true. Set the useUnselectedStyle option to true in order to configure the control to change the appearance of unselected slices by rendering them with a special style. (For details, refer to the Styling topic.)
Configuring the sliceClicked option with an event handler adds or removes the item associated to the clicked slice from an internal array. The event handler uses the ui.selected flag passed from the control to determine whether the slice had just been selected or unselected.
Note: If the API selection changes the sliceClicked event will not fire. You can get the indices of the selected slices using the
selectedSliceItems()method of theigFunnelChart.
Following is the code that implements this example.
In JavaScript:
var selectedSlices = [];
$("#chart").igFunnelChart({
    width: "350px",
    height: "500px",
    dataSource: data,
    valueMemberPath: "Budget",
    innerLabelMemberPath: "Budget",
    innerLabelVisibility: "visible",
    outerLabelMemberPath: "Department",
    outerLabelVisibility: "visible",
    allowSliceSelection: true,
    useUnselectedStyle: true,
    sliceClicked: function (evt, ui) {
        if (ui.selected) {
            selectedSlices.push(ui.item);
        }
        else {
            selectedSlices.removeItem(ui.item);
        }
    }
});
The following topics provide additional information related to this topic.
Binding igFunnelChart to Data: This topic explains how to bind the igFunnelChart control to various data sources.
Styling igFunnelChart: This topic explains how to customize the look-and-feel of the igFunnelChart control.
Accessibility Compliance (igFunnelChart): This topic explains the igFunnelChart control’s accessibility features and provides advice on how to achieve accessibility compliance for pages containing charts.
Known Issues and Limitations (igFunnelChart): This topic lists the known issues related to the igFunnelChart control.
jQuery and MVC API Links (igFunnelChart): This topic lists the links to the API reference documentation for the igFunnelChart control.
The following sample provides additional information related to this topic.
sliceClicked event.View on GitHub