
This topic provides conceptual information about the igFunnelChart™ control including its main features, minimum requirements, and user functionality.
The following table lists the concepts and topics required as a prerequisite to understanding this topic.
This topic contains the following sections:
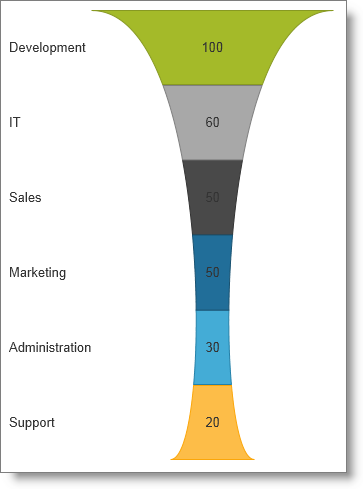
The igFunnelChart is a charting control for rendering funnel charts into HTML5 Web applications and sites. It uses the new HTML5 Canvas tag to plot funnel charts on web pages.
The igFunnelChart control is similar to igPieChart™ in that that they display the values associated to different categories of items. They are different though because the sum of the values shown on a funnel chart is not necessarily the total of some larger entity. Funnel slices are usually displayed sorted by value, either largest to smallest or in reverse order. They can display either with the same height or the height may be proportional to item’s value. The funnel chart usually has a conic shape, but it allows a Bezier curve to form the contour of its left and right sides.
The igFunnelChart control is a jQuery UI widget and, therefore, depends on the jQuery and jQuery UI libraries. The Modernizr library is also used internally for detecting browser and device capabilities. The control uses several Ignite UI for jQuery shared resources for functionality and data binding. References to these resources are needed nevertheless, in spite of pure jQuery or Ignite UI for MVC being used. The Infragistics.Web.Mvc assembly is required when the control is used in the context of ASP.NET MVC.
The following table summarizes the main features of the igFunnelChart control. Additional details are available after following the summary table.
| Feature | Description |
|---|---|
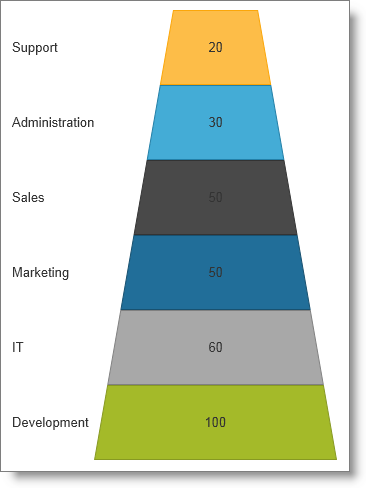
| Inverted funnel | The funnel chart allows to be displayed with smallest value and on top as opposed to the regular view with largest value on top. |
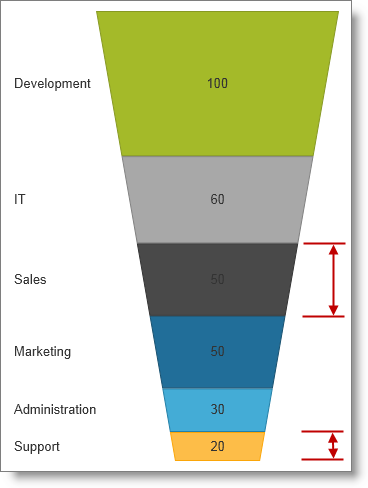
| Weighted slices | You can configure slices to be displayed with different height based on their value. |
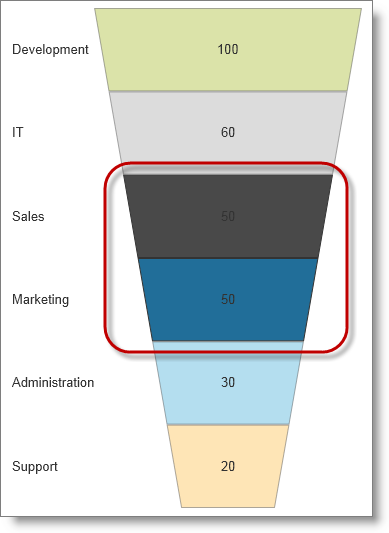
| Slice selection | You can enable slices to be selected and configure selected and unselected style for slices. |
| Bezier-curve shape | You can configure the sides of the funnel chart to take shape in the form of a Bezier curve as opposed to the regular trapezoid shape. |
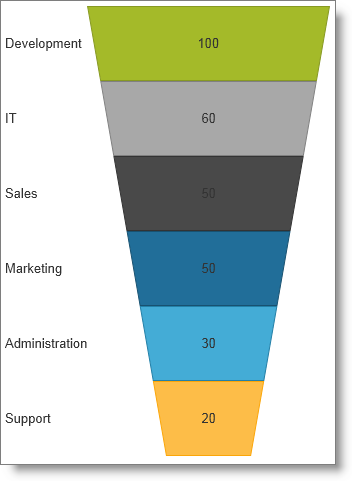
By default, a funnel chart displays the largest slice (the largest data value) on top and the rest of the slices going down sorted in descending order by value. The igFunnelChart can be configured to display slices in ascending order with the smallest value on top.
The igFunnelChart control allows you to configure slices to be displayed with different height depending on their values. That way an extra visual clue is added for the value of a slice.
Slice selection functionality can be enabled for the igFunnelChart control allowing the user to select slices with a single mouse click or screen tap. Another click or tap deselects the slice. Additionally, selected and unselected styles can be defined and applied to the slices depending on their state.
You can add more visual appeal to a funnel chart by making its sides appear as Bezier curves and not straight lines. The control allows you to enable the Bezier curves feature and configure the position of the Bezier control points in order to control the exact shape.
The following table summarizes the user interaction capabilities of the igFunnelChart control.
| The user can… | Using… | Details | Configurable? |
|---|---|---|---|
| Select slice |
|
The igFunnelChart allows the user to select and deselect slices for purposes in the host application. |
 |
The following topics provide additional information related to this topic.
Adding igFunnelChart: This topic demonstrates how to add the igFunnelChart control to a web page and bind it to data.
Binding igFunnelChart to Data: This topic explains how to bind the igFunnelChart control to various data sources.
Configuring igFunnelChart: This topic explains how to configure different visual features and behavior of the igFunnelChart control.
Styling igFunnelChart: This topic explains how to customize the look-and-feel of the igFunnelChart control.
Accessibility Compliance (igFunnelChart): This topic explains the igFunnelChart control’s accessibility features and provides advice on how to achieve accessibility compliance for pages containing charts.
Known Issues and Limitations (igFunnelChart): This topic lists the known issues related to the igFunnelChart control.
igFunnelChart control.The following samples provide additional information related to this topic.
Funnel Chart: This sample demonstrates using the Funnel Chart control to render data as slices from the largest value to the smallest value with the capability to invert the positions of the slices.
Slice Selection: This sample demonstrates enabling the slice selection functionality and handling the sliceClicked event.
View on GitHub