
This topic explains how to configure the Geographic Proportional Symbol series using the igMap™ control.
The following topics are prerequisites to understanding this topic:
igMap Overview: This topic provides conceptual information about the igMap control including its main features, minimum requirements and user interaction capabilities.
Adding an igMap: This topic is a walkthrough for adding a simple igMap control with basic features to a web page.
This topic contains the following sections:
The geographic symbol series of the igMap plots the markers for the geographic points specified by the data in your application. This map series can be useful for highlighting points of interest in your particular business case like department stores, warehouses, or offices. Additional uses of this map series may be in a fleet management system or a GPS system for dynamic vehicle tracking.
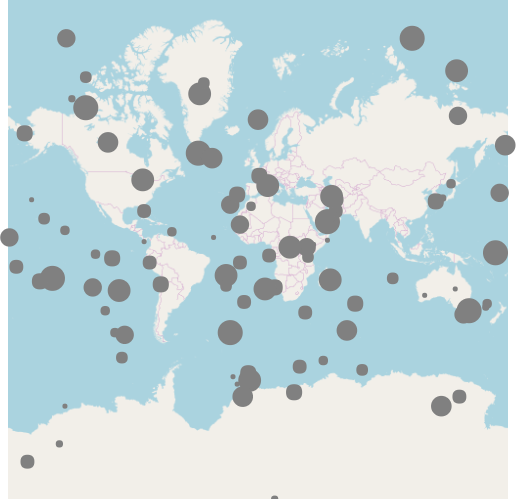
The following screenshot is a preview of the geographic symbol series in the igMap control. The RadiusScale of the symbols uses proportional radius scale in order to indicate the significance of data point's value.
The following table lists the igMap control’s configurable aspects pertaining to the geographic proportional symbol series.
| Configurable aspect | Details | Properties |
|---|---|---|
| Set up geographic proportional symbol series | Use these mandatory settings to configure the type of map series to the geographic proportional symbol and set series name. | In JavaScript: Value: series.type: “geographicProportionalSymbol”, series.type: “seriesName” In ASP.NET MVC: MapSeriesBuilder Class .GeographicProportionalSymbol() Value: series.GeographicProportionalSymbol(“seriesName”) |
| Data binding options of geographic proportional symbol series | Use these mandatory settings to configure which properties of the input data contain the geographic coordinates for drawing the points on the map. | In JavaScript: In ASP.NET MVC: |
| Tooltips visibility | Use these settings to enable or disable tooltip rendering. The default, settings for this control does not render tooltips. | In JavaScript: In ASP.NET MVC: |
| Tooltip template | Use this setting to configure which template to use for rendering the tooltips. | In JavaScript: In ASP.NET MVC: |
| Marker Outline | This mandatory setting configures the color palette for the outlining the values. There is no default value for the setting. | In JavaScript: In ASP.NET MVC: |
| Color palette | This mandatory setting configures the color palette for the values. There is no default value for the setting. | In JavaScript: In ASP.NET MVC: |
| Minimum value for color palette | Configure the minimum value for calculating value sub ranges. | In JavaScript: In ASP.NET MVC: |
| Maximum value for color palette | Configure the maximum value for calculating value sub ranges. | In JavaScript: In ASP.NET MVC: |
| Radius Scale | This mandatory setting configures the radius scale for the bubbles values. There is no default value for the setting. | In JavaScript: In ASP.NET MVC: |
| Minimum value for bubbles | Configure the minimum value for calculating value sub ranges. | In JavaScript: In ASP.NET MVC: |
| Maximum value for bubbles | Configure the maximum value for calculating value sub ranges. | In JavaScript: In ASP.NET MVC: |
The following table lists the code examples included in this topic.
| Example | Description |
|---|---|
| Configure Geographic Symbol Series in JavaScript | This code example shows how to configure an igMap control to display geographic symbol series in JavaScript. |
| Configure Geographic Symbol Series in ASP.NET MVC | This code example shows how to configure an igMap control to display geographic symbol series in ASP.NET MVC. |
This code example shows how to configure an igMap control to display geographic symbol series in JavaScript. The example shows how to specify the data binding options of the series. Automatic marker selection is configured along with marker collision avoidance logic, and marker outline and fill colors are specified too.
In JavaScript:
 $("#map").igMap({
    ...
    series: [{
    name: "series1",
    type: "geographicProportionalSymbol",
    dataSource: data,
    markerType: "circle",
    markerOutline: "black",
    longitudeMemberPath: "Longitude",
    latitudeMemberPath: "Latitude",
    radiusMemberPath: "Magnitude",
    radiusScale: {
        minimumValue: 10,
        maximumValue: 40,
    },
    fillMemberPath: "Magnitude",
    fillScale: {
         type: "value",
         brushes: ["red", "yellow"],
         minimumValue: 1,
         maximumValue: 12
     }
    }],
    ...
});
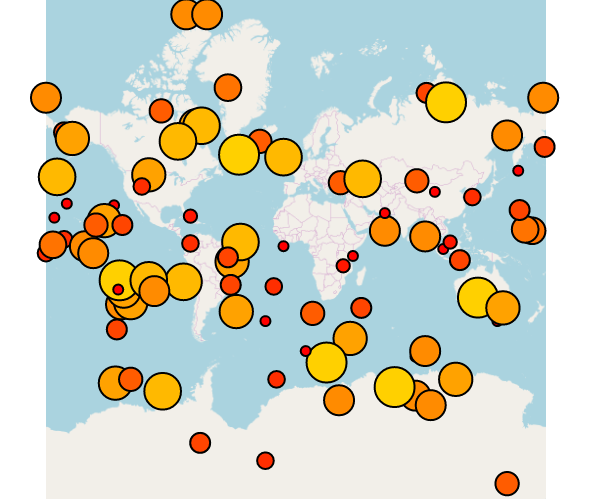
The following screenshot is a result from the code above of the geographic symbol series in the igMap control with a defined radiusScale, markerOutline, and fillScale.
The following topics provide additional information related to this topic.
Configuring the Map Series (igMap): This topic is a landing page linking to the topics explaining how to configure all supported map visualizations by the igMap control and how to use different background content (map providers).
Configuring Features (igMap): This topic is a landing page linking to the topics explaining how to configure various features of the igMap control.
Data Binding (igMap): This topic explains how to bind the igMap control to different data sources depending on the map series visualized.
Styling Maps (igMap):This topic explains how the igMap control can be configured with regard to visual styling.
The following samples provide additional information related to this topic.
View on GitHub