
This topic explains, in both conceptual and step-by-step form, how to add the igPivotView™ control to an HTML page.
The following topics are prerequisites to understanding this topic:
Using JavaScript Resources in Ignite UI for jQuery: This topic provides general guidance on adding the required JavaScript resources for using the controls from the Ignite UI for jQuery® library.
igPivotView Overview: This topic provides conceptual information about the igPivotView control including its main features, requirements, and user functionality.
This topic contains the following sections:
The igPivotView operates using an instance of igOlapFlatDataSource™ or igOlapXmlaDataSource™. Therefore, when adding the igPivotView to an HTML page, you need to provide a pre-configured data source instance or specify the required options so that one could be created internally.
The data source is specified through either the dataSource parameter or the dataSourceOptions property of the igPivotView. The data source setting is the only mandatory option to set when initializing the igPivotView.
The following table summarizes the requirements for using the igPivotView control.
| Requirement / Required Resources | Description | What you need to do… | ||||||||||||||||||||||||||||||||
|---|---|---|---|---|---|---|---|---|---|---|---|---|---|---|---|---|---|---|---|---|---|---|---|---|---|---|---|---|---|---|---|---|---|---|
| jQuery and jQuery UI JavaScript resources | Ignite UI for jQuery™ is built on top of these frameworks: |
Add script references to both libraries in the <head> section of your page.
|
||||||||||||||||||||||||||||||||
| Modernizr library (Optional) | The Modernizr library is used by the igPivotView to detect browser and device capabilities. It is not mandatory and, if not included, the control will behave as if in a normal desktop environment with an HTML5 compatible browser. |
Add a script reference to the library in the <head> section of your page.
|
||||||||||||||||||||||||||||||||
| General igPivotView JavaScript Resources |
The igPivotView functionality of the Ignite UI for jQuery library is distributed across several files. You can load the required resources in one of the following ways:
|
Add one of the following:
|
||||||||||||||||||||||||||||||||
| IG Theme (Optional) |
This theme contains the visual styles for the Ignite UI for jQuery library. The theme file is:
|
|||||||||||||||||||||||||||||||||
| igPivotView CSS resources files |
The styles from the following CSS file are used for rendering various elements of the control:
|
Add style reference to the file in your page. |
Following are the general conceptual steps for adding the igPivotView to an HTML page.
1. Adding references to required resources
2. Adding HTML markup required by the igPivotView
3. Adding a data source
4. Initializing the igPivotView
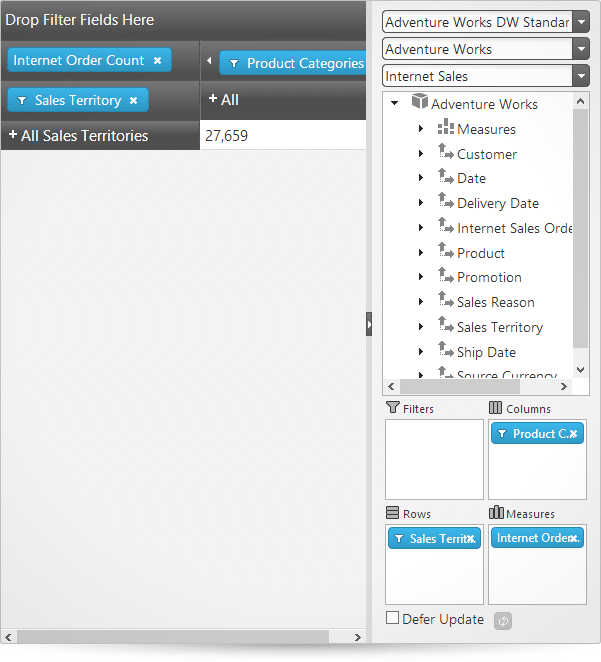
The procedure below demonstrates, with code examples, how to add the igPivotView component to an HTML application visualizing the Adventure Works sample database. The procedure uses the Infragistics Loader (igLoader) to reference the required resources, which is the recommended option.
The following screenshot is a preview of the final result.
To complete the procedure, you need the following:
$.ig.OlapXmlaDataSource object or $.ig.OlapFlatDataSource object1. Adding references to required resources
2. Adding HTML markup required by the igPivotView
3. Adding a data source
4. Initializing the igPivotView
The following steps demonstrate how to add a jQuery igPivotView.
Add references to required resources.
Organize the required files.
A. Add the jQuery, jQueryUI, and Modernizr JavaScript resources to a folder named Scripts in the directory where your web page resides.
B. Add the Ignite UI for jQuery CSS files to a folder named Content/ig (For details, see the Styling and Theming in Ignite UI for jQuery topic).
C. Add the Ignite UI for jQuery JavaScript files to a folder named Scripts/ig in your web site or application (For details, see the Using JavaScript Resources in Ignite UI for jQuery topics).
Add the references to the required JavaScript libraries. Add references to the jQuery, jQuery UI and Modernizr libraries to the <head> section of your page:
In HTML:
 <script  type="text/javascript" src="Scripts/jquery.js"></script>
 <script  type="text/javascript" src="Scripts/jquery-ui.js"></script>
 <script  type="text/javascript" src="Scripts/modernizr.js"></script>
Add a reference to igLoader.Include the igLoader script in the page:
In HTML:
<script type="text/javascript" src="Scripts/ig/infragistics.loader.js"></script>
Load the required resources.
Instantiate igLoader:
In HTML:
<script type="text/javascript">
Add HTML markup required by the igPivotView.
Create a div tag with an id of “dataSelector” in your HTML page.
In HTML:
<div id="pivotView"></div>
Add a data source.
In the igLoader’s ready event handler, add the data source declaration:
In JavaScript:
 var dataSource = new $.ig.OlapXmlaDataSource({
     serverUrl: "http://sampledata.infragistics.com/olap/msmdpump.dll",
     catalog: "Adventure Works DW Standard Edition",
     cube: "Adventure Works",
     measureGroup: "Internet Sales",
     rows: "[Sales Territory].[Sales Territory]",
     columns: "[Product].[Product Categories]",
     measures: "[Measures].[Internet Order Count],[Measures].[Internet Gross Profit Margin]"
 });
For this data source to work correctly under IE, before adding the data source declaration, you need to set the jQuery cross-origin requests support to true:
In JavaScript:
$.support.cors = true;
Initialize the igPivotView
In order for the igPivotView to be loaded, the following code must be added after the data source declaration.
In JavaScript:
 $("#pivotView").igPivotView({
 dataSource: dataSource
 });
Following is the alternative (direct) way to specify a data source using the dataSourceOptions property of the igPivotView. (See Adding igPivotView summary.)
In JavaScript:
 $("#dataSelector").igPivotView({
       dataSourceOptions: {
        xmlaOptions: {
           serverUrl: " http://sampledata.infragistics.com/olap/msmdpump.dll ",
           catalog: "Adventure Works DW Standard Edition ",
           cube: "Adventure Works",
           measureGroup: "Internet Sales",
        }
        rows: "[Sales Territory].[Sales Territory]",
        columns: "[Product].[Product Categories]",
        measures: "[Measures].[Internet Order Count],[Measures].[Internet Gross Profit Margin]"
     }
 });
The following topics provide additional information related to this topic.
igPivotView control to an ASP.NET MVC Application using Ignite UI for MVC.The following samples provide additional information related to this topic.
Binding to Flat Data Source: This sample demonstrates how to bind the igPivotView to an igOlapFlatDataSource.
Binding to XMLA to Show KPIs: This sample demonstrates how to bind the igPivotView to an igOlapXmlaDataSource.
View on GitHub