
This topic is a walkthrough for adding a simple igMap™ control with basic features to a web page.
The following table lists the topics and external articles required as a prerequisite to understanding this topic.
Topics
Ignite UI for jQuery Overview: General information on the Ignite UI for jQuery™ library.
Using JavaScript Resouces in Ignite UI for jQuery: This topic provides general guidance on adding required JavaScript resources to use controls from the Ignite UI for jQuery library.
igMap Overview: This topic provides conceptual information about the igMap control including its main features, minimum requirements, and user interaction capabilities.
External Resources
This topic contains the following sections:
This procedure guides you through the steps for adding a map with basic functionality to a web page in the context of the geographic symbol series that plots points on the map. Geographic coordinates in the data bound to the control specifies these plotted points. The example shows an HTML/jQuery implementation. It includes the proper igLoader™ configuration for using the igMap control, binding to a local JavaScript array and configuring the essential options for the operation of the control.
Following are the requirements for adding a map to a web page:
You can add the references either manually or using the Infragistics Loader (recommended).
For loading the resources with the Loader, use the following code to include the igLoader script in the page:
In HTML:
<script type="text/javascript" src="/Scripts/ig/js/infragistics.loader.js"></script>
…and then instantiate the Loader for HTML views:
In HTML:
<script type="text/javascript">
    $.ig.loader({
        scriptPath: "/Scripts/ig/",
        cssPath: "/Content/ig/",
        resources: "igMap"
    });
</script>
If you prefer to load resources statically, refer to the topic Overview (igMap), Minimum Requirements to see which resource files must be linked to use maps.
In HTML:
<script type="text/javascript">
    var data = [
        { Name: "Warsaw", Country: "Poland", Latitude: 52.21, Longitude: 21 },
        { Name: "London", Country: "England", Latitude: 51.50, Longitude: 0.12 },
        { Name: "Berlin", Country: "Germany", Latitude: 52.50, Longitude: 13.33 },
        { Name: "Moscow", Country: "Russia", Latitude: 55.75, Longitude: 37.51 },
        { Name: "Sydney", Country: "Australia", Latitude: -33.83, Longitude: 151.2 },
        { Name: "Tokyo", Country: "Japan", Latitude: 35.6895, Longitude: 139.6917 },
        { Name: "Seoul", Country: "South Korea", Latitude: 37.5665, Longitude: 126.9780 },
        { Name: "Delhi", Country: "India", Latitude: 28.6353, Longitude: 77.2250 },
        { Name: "Mumbai", Country: "India", Latitude: 19.0177, Longitude: 72.8562 },
        { Name: "Manila", Country: "Philippines", Latitude: 14.6010, Longitude: 120.9762 },
        { Name: "Shanghai", Country: "China", Latitude: 31.2244, Longitude: 121.4759 },
        { Name: "Mexico City", Country: "Mexico", Latitude: 19.4270, Longitude: -99.1276 },
        { Name: "New York", Country: "United States", Latitude: 40.7561, Longitude: -73.9870 },
        { Name: "Sao Paulo", Country: "Brasil", Latitude: -23.5489, Longitude: -46.6388 },
        { Name: "Los Angeles", Country: "United States", Latitude: 34.0522, Longitude: -118.2434 },
        { Name: "Sofia", Country: "Bulgaria", Latitude: 42.697845, Longitude: 23.321925 }
    ];
</script>
The following screenshot is a preview of the result.
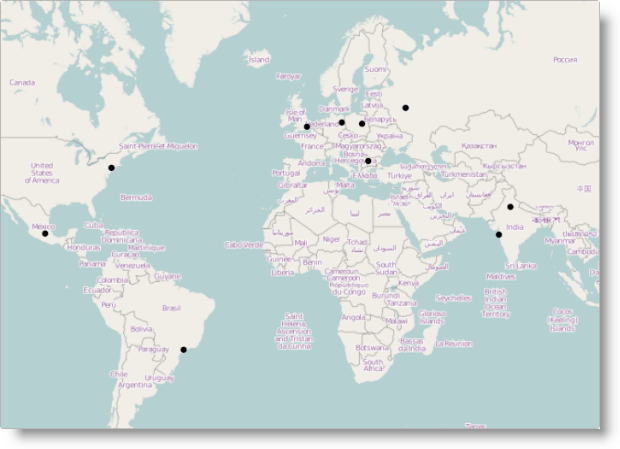
To complete the procedure, you need an HTML5 web page.
Following is a conceptual overview of the process:
The following steps demonstrate how to add a basic igMap control instance to a web page.
Add the HTML markup required by the igMap control.
The igMap control requires the addition of a div element to the page. The control, with all required markups to display a map on the page, updates the div element.
In HTML:
<div id="map"></div>
The igMap control must be instantiated in a script tag of the HTML page so that it can wrap the div element created in step 1. Adding the HTML markup required by the igMap control. The code instantiates the map. Additional information is available following the code snippet.
In HTML:
 <script type="text/javascript">
     $.ig.loader(function () {
         $("#map").igMap({
             width: "700px",
             height: "500px",
             backgroundContent: {
                 type: "openStreet"
             },
             series: [{
                 type: "geographicSymbol",
                 name: "worldCities",
                 dataSource: data,
                 latitudeMemberPath: "Latitude",
                 longitudeMemberPath: "Longitude",
                 markerType: "automatic"
             }],
             windowRect: {
                 left: 0.27,
                 top: 0.20,
                 height: 0.45,
                 width: 0.45
             }
         });
     });
 </script>
The width and height options set the size of the map on the page. Due to the tight coupling between the map window position and its aspect ratio it is important to set a specific (for your application) aspect ratio when displaying a particular area of the World map.
The backgroundContent option sets, which map provider to use. This example uses the OpenStreetMap provider. This is the default provider; use it if you omit the backgroundContent option. You can refer to the Configuring Map Provider topic for details on using Bing® Maps and OpenStreetMap.
The definition of the geographicSymbol series configures the visualization data series options. You must specify a name for the series, and a dataSource containing the visualization data. Additionally, you need to specify which attributes of the incoming data are the geographic coordinates with the latitudeMemberPath and longitudeMemberPath options. Finally, the markerType configures the control for automatically selecting which markers to use when displaying the geographic points. For details on configuring other series types, refer to the Creating Different Kinds of Maps landing page and the topics linked from there.
The windowRect option specifies the exact rectangular region of the World map initially rendered by the control. The values specified are in relative units between 0 and 1, where 0 is the extreme Northern (top most) or Western (left most) point from the World map. For more details, refer to the Configuring Navigation Features topic.
To verify the result, save the page and view the final result in a web browser. If you have done the steps correctly, the map will look like the one shown in the Preview.
This procedure guides you through the steps for adding a map with basic functionality to an ASP.NET MVC view. Done in the context of the geographic symbol series that plots points on the map specified by the geographic coordinate’s data bound to the control. The example uses the ASP.NET MVC syntax together with the required Loader configuration, binding to a data model object passed by a controller action method and setting essential options for the operation of the control to accomplish this.
Following are the requirements for adding a map to an ASP.NET MVC View:
You can the references either manually or using the Infragistics Loader (recommended).
For loading the resources with the Loader, use the following code to
include the igLoader script in the page:
In HTML:
<script type="text/javascript" src="/Scripts/ig/js/infragistics.loader.js"></script>
…and then reference the Infragistics.Web.Mvc assembly in your ASP.NET MVC project and the Infragistics.Web.Mvc namespace in your view. For details, see Using JavaScript Resources in Ignite UI for jQuery. In the interest of clarity, the code to reference the namespace follows below.
In ASPX:
<%@ Import Namespace="Infragistics.Web.Mvc" %>
. . .
<%= Html.Infragistics().Loader()
        .ScriptPath(Url.Content("~/Scripts/ig/")
        .CssPath(Url.Content("~/Content/ig/")
        .Render()
%>
If you prefer to load resources statically,,refer to the topic Overview (igMap), Minimum Requirements to see which resource files must be linked to use maps.
A data source. For illustration purposes, the following code for the Index method is used in the procedure:
In C#:
public ActionResult Index()
{
    List<WorldCity> worldCities = new List<WorldCity>
    {
        new WorldCity { Name = "Warsaw", Country = "Poland",
            Latitude = 52.21, Longitude = 21 },
        new WorldCity { Name = "London", Country = "England",
            Latitude = 51.50, Longitude = 0.12 },
        new WorldCity { Name = "Berlin", Country = "Germany",
            Latitude = 52.50, Longitude = 13.33 },
        new WorldCity { Name = "Moscow", Country = "Russia",
            Latitude = 55.75, Longitude = 37.51 },
        new WorldCity { Name = "Sydney", Country = "Australia",
            Latitude = -33.83, Longitude = 151.2 },
        new WorldCity { Name = "Tokyo", Country = "Japan",
            Latitude = 35.6895, Longitude = 139.6917 },
        new WorldCity { Name = "Seoul", Country = "South Korea",
            Latitude = 37.5665, Longitude = 126.9780 },
        new WorldCity { Name = "Delhi", Country = "India",
            Latitude = 28.6353, Longitude = 77.2250 },
        new WorldCity { Name = "Mumbai", Country = "India",
            Latitude = 19.0177, Longitude = 72.8562 },
        new WorldCity { Name = "Manila", Country = "Philippines",
            Latitude = 14.6010, Longitude = 120.9762 },
        new WorldCity { Name = "Shanghai", Country = "China",
            Latitude = 31.2244, Longitude = 121.4759 },
        new WorldCity { Name = "Mexico City", Country = "Mexico",
            Latitude = 19.4270, Longitude = -99.1276 },
        new WorldCity { Name = "New York", Country = "United States",
            Latitude = 40.7561, Longitude = -73.9870 },
        new WorldCity { Name = "Sao Paulo", Country = "Brasil",
            Latitude = -23.5489, Longitude = -46.6388 },
        new WorldCity { Name = "Los Angeles", Country = "United States",
            Latitude = 34.0522, Longitude = -118.2434 },
        new WorldCity { Name = "Sofia", Country = "Bulgaria",
            Latitude = 42.697845, Longitude = 23.321925 }
    };
    return View(worldCities.AsQueryable());
}
The following screenshot is a preview of the result.
To complete the procedure, you need an ASP.NET MVC web application in Visual Studio.
Following is a conceptual overview of the process:
The following steps demonstrate how to add a basic igMap control instance to an MVC application.
The way to supply data for an ASP.NET MVC view is through a controller method using an appropriate data model definition. The following code illustrates the data model part. Create a new empty class, name it WorldCity, save it to your ASP.NET MVC application’s Models folder, and add the following code.
In C#:
 namespace SampleMvcApp.Models
 {
     public class WorldCity
     {
         public string Name { get; set; }
         public string Country { get; set; }
         public double Latitude { get; set; }
         public double Longitude { get; set; }
     }
 }
By design the model class stores data about the location of a city on the World map with its Name, Country, and geographic coordinates (Latitude and Longitude).
Add the controller action method.
Add an empty controller class in the Controllers folder of your ASP.NET MVC application.
The controller action initializes a list of WorldCity objects with data provided by either a database or an external data service in your application and invokes the default view for the controller with the data.
Create the view corresponding to the controller action method. Add the following code to make the view strongly-typed and point to the data model class created above:
In ASPX:
 <%@ Page Language="C#" Inherits="IQueryable<SampleMvcApp.Models.WorldCity>"
     MasterPageFile="~/Views/Shared/MvcSite.Master" %>
Instantiate the igMap control.
Use the code provided here to instantiate your map. Additional information is available following the code snippet below.
In ASPX:
 <%= Html.Infragistics().Map(Model)
         .ID("map")
         .Width("700px")
         .Height("500px")
         .BackgroundContent(bgr => bgr.OpenStreetMaps())
         .Series(series => {
             series.GeographicSymbol("worldCities")
                 .LatitudeMemberPath(item => item.Latitude)
                 .LongitudeMemberPath(item => item.Longitude)
                 .MarkerType(MarkerType.Automatic)
         })
         .WindowRect(0.27, 0.20, 0.5, 0.5)
         .DataBind()
         .Render()
 %>
Assignment of the data model object declared for the view to the control occurs in the Map(Model) call. The members of the model are referenced in the map series definition.
The Width and Height calls set the size of the map on the page. Due to the tight coupling between the map window position and its aspect ratio, it is important to set a specific (for your application) aspect ratio when displaying a particular area of the World map.
The BackgroundContent call specifies which map provider your application uses. This example uses the OpenStreetMap provider. This is the default provider, used if you omit the BackgroundContent() call. You can refer to the Configuring Map Provider topic for details on using Bing® Maps and OpenStreetMap.
The Series call configures the definition of the GeographicSymbol series. Specify, within the call, the name “worldCities” for use in the series. You need to specify which attributes of the incoming data are the geographic coordinates using the LatitudeMemberPath and LongitudeMemberPath options. Finally, the MarkerType call configures the control to select automatically what markers to use for the displayed geographic points. For details on configuring other series types, refer to the Creating Different Kinds of Maps landing page and the topics linked therein.
The WindowRect call specifies the exact rectangular region of the World map initially rendered by the control. The values specified are in relative units between 0 and 1 with 0 representing the extreme Northern (top most) or Western (left most) point on the World map. For more details, refer to the Configuring Navigation Features topic.
To verify the result, save the page and view the result in a web browser. If you have done the steps correctly, the map will look like the one shown in the Preview.
The following topics provide additional information related to this topic.
Data Binding (igMap):This topic explains how to bind the igMap control to different data sources depending on the map series visualized.
Styling Maps (igMap):This topic explains to customize the look-and-feel of the igMap control using themes.
Configuring Features (igMap):The topics in this group explain how to configure the various features of the igMap control. Features covered include navigation to specific geographic area, enabling/disabling of the Overview Plus Detail panel, getting the currently displayed area on the map, configuring interaction with the user regarding panning and zooming, configuring tooltip templates, and setting a custom marker.
Configuring the Map Series (igMap):The topics in this group explain how to configure all supported map types (map series) of the igMap control in order to produce many different kinds of maps.
API Links (igMap):This topic provides links to the API documentation for the jQuery and its ASP.NET MVC helper class for the igMap control.
The following samples provide additional information related to this topic.
Map Tooltips:This sample demonstrates how to set map tooltips in a map control and bind a View Model to the control.
Geographic Symbol Series:This sample demonstrates how to create maps and visualize Geographic Symbol series.
View on GitHub