
This topic walks through using Ignite UI for MVC to instantiate an igDoughnutChart™ in an ASP.NET MVC application.
The following table lists the concepts and topics required as a prerequisite to understanding this topic.
This topic contains the following sections:
The successful addition of igDoughnutChart to an ASP.NET MVC application, using Ignite UI for MVC requires that you adjust its size by specifying values for its height and width options and adding at least one series to it.
You must provide a pre-configured data source instance, or create one internally for the series. Apart from the dataSource option, in order to display the control, the name and valueMemberPath options require a value. The valueMemberPath parameter contains the value used in creating the slices of the series. In this example, the ProductItemCollection model is used to instantiate the dataSource option of the series. The valueMemberPath of the series is set to Index and uses its value to build its slices.
An ASP.NET MVC application configured with the required JavaScript files, CSS files, and ASP.NET MVC assembly as outlined in the Adding Controls to an MVC Project topic.
This topic walks through using Ignite UI for MVC to instantiate an igDoughnutChart in an ASP.NET MVC application.
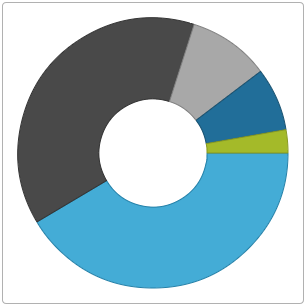
The following screenshot is a preview of the result.
To complete the procedure, you need the following:
Following is a conceptual overview of the process:
This topic walks through using Ignite UI for MVC to instantiate an igDoughnutChart in an ASP.NET MVC application.
Add a reference to Infragistics.Web.Mvc.dll
Add a reference to the Infragistics.Web.Mvc.dll to your ASP.NET application. The details for adding this assembly are available in the Adding Controls to an MVC Project topic.
Configure the view dependencies
1. Import the Infragistics.Web.Mvc namespace
In order to use Ignite UI for MVC, you must first import the Infragistics.Web.Mvc namespace onto your view.
In ASPX:
<%@ Import Namespace="Infragistics.Web.Mvc" %>
2. Add references to the combined files for all data visualization controls
Add the following file references to the HEAD tag of the ASP.NET MVC View (you might as well use igLoader or explicitly include all Doughnut Chart related files as explained in the Adding igDoughnutChart to an HTML Page topic) :
In ASPX:
 <link href="<%=Url.Content("~/Scripts/css/structure/modules/infragistics.ui.chart.css")%>" rel="stylesheet"></link>
 <link href="<%=Url.Content("~/Scripts/css/themes/infragistics/infragistics.theme.css")%>" rel="stylesheet"></link>
 <script src="<%=Url.Content("~/Scripts/jquery.min.js")%>" type="text/javascript"></script>
 <script src="<%=Url.Content("~/Scripts/jquery-ui.min.js")%>" type="text/javascript"></script>
 <script src="<%=Url.Content("~/Scripts/js/infragistics.core.js")%>" type="text/javascript"></script>
 <script src="<%=Url.Content("~/Scripts/js/infragistics.dv.js")%>" type="text/javascript"></script>
Define the data collection
1. Define the model object ProductItem
Define a basic ProductItem object in your application to use for the data collection.
In C#:
 public class ProductItem
 {
     public string ProductCategory { get; set; }
     public int Index { get; set; }
 }
2. Create a collection of ProductItem objects
In C#:
 using System.Collections.Generic;
 namespace DoughnutChartMVC
 {
     public class ProductItemCollection : List<ProductItem>
     {
         public ProductItemCollection()
         {
             this.Add(new ProductItem { ProductCategory = "Footwear", Index = 1498 });
             this.Add(new ProductItem { ProductCategory = "Clothing", Index = 1389 });
             this.Add(new ProductItem { ProductCategory = "Books", Index = 352 });
             this.Add(new ProductItem { ProductCategory = "Accessories", Index = 273 });
             this.Add(new ProductItem { ProductCategory = "Equipment", Index = 100 });
         }
     }
 }
3. Return the collection as view model in the action method of your controller.
In C#:
 using System.Web.Mvc;
 namespace DoughnutChartMVC.Controllers
 {
     public class HomeController : Controller
     {
         public ActionResult Index()
         {
             var products = new ProductItemCollection();
             return View("Index", new ProductItemCollection());
         }
     }
 }
Add the ProductItemCollection as a model for the view.
In ASPX:
<%@ Page Language="C#" Inherits="System.Web.Mvc.ViewPage<DoughnutChartMVC.ProductItemCollection>" %>
Instantiate the igDoughnutChart
Use Ignite UI for MVC and set basic options in order to Instantiate the igDoughnutChart. Use Ignite UI for MVC within the body of your ASP.NET page to instantiate the igDoughnutChart. Several helper methods need to be set for a basic rendering when instantiating the control, there are including the following:
| Helper Method | Purpose |
|---|---|
| Width() |
Sets the string width of the igDoughnutChart
|
| Height() |
Sets the string height of the igDoughnutChart
|
| Series() |
Instantiates a series for the igDoughnutChart. Apart from its dataSource, a name must be assigned to the series and its valueMemberPath property must get a value which will be used to determine the size of the slices.
|
Finally, as with all of the Ignite UI for MVC controls, you must call the Render method to render the HTML and JavaScript to the view.
In ASPX:
 <body>
     <%= Html.Infragistics().DoughnutChart()
                     .Width("300px")
                     .Height("300px")
                     .Series(s =>
                     {
                         s.Ring("flatSeries", Model.AsQueryable())
                             .ValueMemberPath(o => o.Index);
                         })
                      .Render()%>
 </body>
Full Application Code Listing
In ASPX:
<%@Page Language="C#" Inherits="System.Web.Mvc.ViewPage<DoughnutChartMVC.ProductItemCollection>" %>
<%@ Import Namespace="Infragistics.Web.Mvc" %>
<!DOCTYPE html>
<html>
<head>
    <title>DoughnutChart</title>
    <link href="<%=Url.Content("~/Scripts/css/structure/modules/infragistics.ui.chart.css")%>" rel="stylesheet"></link>
    <link href="<%=Url.Content("~/Scripts/css/themes/infragistics/infragistics.theme.css")%>" rel="stylesheet"></link>
    <script src="<%=Url.Content("~/Scripts/jquery.min.js")%>" type="text/javascript"></script>
    <script src="<%=Url.Content("~/Scripts/jquery-ui.min.js")%>" type="text/javascript"></script>
    <script src="<%=Url.Content("~/Scripts/js/infragistics.core.js")%>" type="text/javascript"></script>
    <script src="<%=Url.Content("~/Scripts/js/infragistics.dv.js")%>" type="text/javascript"></script>
</head>
<body>
    <%= Html.Infragistics().DoughnutChart()
                    .Width("300px")
                    .Height("300px")
                    .Series(s =>
                    {
                        s.Ring("flatSeries", Model.AsQueryable())
                            .ValueMemberPath(o => o.Index);
                        })
                     .Render()%>
</body>
</html>
The following topics provide additional information related to this topic.
Adding igDoughnutChart to an HTML Page: This topic explains how to add the igDoughnutChart to an HTML page.
jQuery and MVC API Links (igDoughnutChart): This topic provides links to the API documentation about the igDoughnutChart control and the Ignite UI for MVC for it.
The following sample provides additional information related to this topic.
igDoughnutChart using Ignite UI for MVC. The helper binds to a collection of objects on the server and serializes the collection to JSON objects and renders the required igDoughnutChart HTML and JavaScript.View on GitHub