
This topic demonstrates how to add the igFunnelChart™ control to an HTML page and bind it to data.
The following table lists the concepts and topics required as a prerequisite to understanding this topic.
igFunnelChart control including its main features, minimum requirements, and user functionality.This topic contains the following sections:
When adding the igFunnelChart to an HTML page, you need to provide a pre-configured data source instance or specify the required options so that one could be created internally. For more details about possible data sources, see the Bind to Data topic.
The data source is specified through the dataSource property of the igFunnelChart. The data source and height settings are the only mandatory options to set when initializing the igFunnelChart.
Adding the igFunnelChart control to an HTML page requires referencing the resources listed below. These resources are required for both JavaScript and ASP.NET MVC. (The JavaScript-specific and MVC-specific requirements are listed in the respective sections, Adding an igFunnelChart to an HTML Page in JavaScript and Adding an igFunnelChart to an HTML Page in ASP.NET MVC.)
| Requirement | Description | ||||||||||||||||||||||||||||
|---|---|---|---|---|---|---|---|---|---|---|---|---|---|---|---|---|---|---|---|---|---|---|---|---|---|---|---|---|---|
| HTML5 canvas API | The functionality of the charting library is based on the HTML5 Canvas tag and its related API. Any web browser that supports these will be able to render and display charts generated by the igFunnelChart control. No other HTML5 features are required for the operation of the igFunnelChart control. For details about which versions of the most popular desktop and mobile web browsers support the HTML5 Canvas API, refer to Canvas Element. | ||||||||||||||||||||||||||||
| jQuery and jQuery UI JavaScript resources | Ignite UI for jQuery is built on top of these frameworks: | ||||||||||||||||||||||||||||
| Modernizr | The Modernizr library is used by the igFunnelChart to detect browser and device capabilities. It is not mandatory and if not included the control will behave as if it works in a normal desktop environment with HTML5 compatible browser. | ||||||||||||||||||||||||||||
| Charting JavaScript resources |
The charting functionality of the Ignite UI for jQuery library is distributed across several files depending on the series type. Also, there is a separate funnel chart JavaScript file which must be linked to you HTML or MVC views.
In case you wish to include resources manually, you need to use the dependencies listed in the following table.
|
||||||||||||||||||||||||||||
| IG theme |
This theme contains custom visual styles created for the Ignite UI for jQuery library. It is contained in the following file: <IG CSS root>/themes/Infragistics/infragistics.theme.css |
||||||||||||||||||||||||||||
| Chart structure |
This CSS resource is used by the charting components for rendering different elements of the controls: <IG CSS root>/structure/modules/infragistics.ui.chart.css |
Note: It is recommended to use the
igLoadercomponent to load JavaScript and CSS resources. For information on how to do it, refer to the Using Infragistics Loader topic. In addition to that, in the online Ignite UI for jQuery Samples Browser, you can find some specific examples on how to use theigLoaderwith theigFunnelChartcomponent.
This procedure guides you through the steps for adding a funnel chart with basic functionality to a web page. The example shows a pure HTML/JavaScript implementation. It includes proper Loader configuration for loading all Ignite UI for jQuery resources needed by the igFunnelChart control.
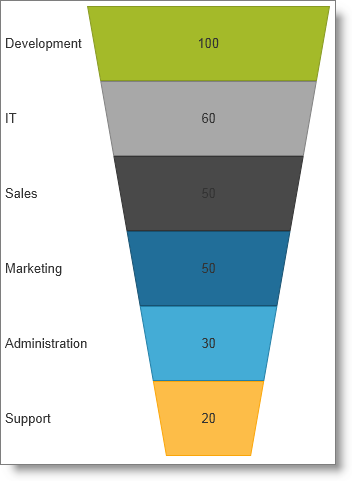
The procedure instantiates and configures a 325x450-pixel funnel chart with default sort order (highest value on top), weighted slices and straight side lines representing the budget of the departments of a company. The data is supplied to the igFunnelChart control in the form of a JSON array (configured, too, in the procedure). In addition to that basic tuning, the paths, and the visual state of igFunnelChart’s labels are configured in order to have descriptive information about the data that is shown.
The following screenshot is a preview of the result.
Following is a conceptual overview of the process:
3. Instantiating igFunnelChart
4. (Optional) Verifying the result
The following steps demonstrate how to add a basic funnel chart control to a web page.
Add a reference to the igLoader script file.
The following is an example <script> tag for loading the igLoader script to your page.
In HTML:
<script src="/Scripts/ig/js/infragistics.loader.js"></script>
Add the igLoader configuration for igFunnelChart.
Add the following code to a <script> element on your page.
In JavaScript:
 $.ig.loader({
     scriptPath: "/Script/ig/",
     cssPath: "/Content/ig/",
     resources: "igFunnelChart,igChartLegend"
 });
As a data source, add a JavaScript array in a <script> element on your page.
In JavaScript:
 var data = [
     { Budget: 30, Department: "Administration" },
     { Budget: 50, Department: "Sales" },
     { Budget: 60, Department: "IT" },
     { Budget: 50, Department: "Marketing" },
     { Budget: 100, Department: "Development" },
     { Budget: 20, Department: "Support" }
 ];
Adding an HTML element to the funnel chart.
Add an HTML <div> element which will host the funnel chart on your HTML page.
In HTML:
<div id="funnel"></div>
Instantiating the igFunnelChart.
Add the following initialization code to a <script> element in your page.
In JavaScript:
 $.ig.loader(function () {
     //  Create a basic funnel chart
     $("#funnel").igFunnelChart({
         width: "325px",
         height: "450px",
         dataSource: data,
         valueMemberPath: "Budget",
         innerLabelMemberPath: "Budget",
         innerLabelVisibility: "visible",
         outerLabelMemberPath: "Department",
         outerLabelVisibility: "visible"
     });
 });
The code above creates a funnel chart in the <div> element added earlier.
The width and height options are assigned with the size of the chart on the page and their values can be specified in any unit of measure available in CSS.
Assign the object that provides data to the chart to the dataSource option. The valueMemberPath option is set with the name of the field in the data source containing the data to be visualized. The innerLabelMemberPath and outerLabelMemberPath options are set with the names of the fields in the data source containing labels or names to be displayed for every slice.
The innerLabelVisibility and outerLabelVisibility options determine whether inner and outer labels are displayed. The inner label is the text displayed inside a slice and outer label is the text displayed to left or right of the slice.
To verify the result, save the page and view the result in a web browser. If you have done the steps correctly, the map will look like the one shown in the Preview.
This procedure guides you through the steps for adding a funnel chart with basic functionality to an ASP.NET MVC View.
The procedure instantiates and configures a 325x450-pixel funnel chart
with default sort order (highest value on top), weighted slices and
straight side lines representing the budget of the departments of a
company. The data is supplied to the igFunnelChart control in the form
of a JSON array (configured, too, in the procedure). In addition to that
basic tuning, the paths, and the visual state of igFunnelChart’s
labels are configured in order to have descriptive information about the
data that is shown.
The example uses the ASP.NET MVC syntax together with the required Loader configuration, binding to a data model object passed by a controller action method and setting essential options for the operation of the control to accomplish this.
The way to supply data for an ASP.NET MVC View is through a controller method using an appropriate data model definition. The model represents an entry from the budget of a company having a decimal field for the Budget of the specified Department.
The example is shown in the context of the budget an imaginary company.
The following screenshot is a preview of the final result.
Following are the general requirements for adding an igFunnelChart to an HTML page in ASP.NET MVC:
igFunnelChart.Following is a conceptual overview of the process:
The following steps demonstrate how to add a basic funnel chart control to an ASP.NET MVC application.
The following code illustrates the data model part.
BudgetData.Add the following code, which represents an entry from the budget of a company having a decimal field for the Budget of the specified Department:
In C#:
public class BudgetData
{

    public decimal Budget { get; set; }
    public string Department { get; set; }

}
Add the controller action method.
Add an empty controller class in the Controllers folder of your ASP.NET MVC application.
The controller action initializes a list of BudgetData objects with data provided by either a database or an external data service in your application. Then the controller invokes the default View for the controller with the data.
In C#:
 public ActionResult Index()
 {
     var data = new List<BudgetData>()
     {
         new BudgetData { Budget = 30, Department = "Administration" },
         new BudgetData { Budget = 50, Department = "Sales" },
         new BudgetData { Budget = 60, Department = "IT" },
         new BudgetData { Budget = 50, Department = "Marketing" },
         new BudgetData { Budget = 100, Department = "Development" },
         new BudgetData { Budget = 20, Department = "Support" }
     };
     return View(data.AsQueryable());
 }
Add a strongly typed ASP.NET MVC View.
To add and configure the View:
1. Create the View corresponding to the controller action method.
2. Make the View strongly-typed and point to the data model class created above in step 3.1.
In ASPX:
@model IQueryable<MvcApp.Models.BudgetData>
Add a reference to the igLoader script file.
The following an example <script> tag for loading the igLoader script to your page.
In HTML:
<script src="/Scripts/ig/js/infragistics.loader.js"></script>
Add the igLoader’s configuration for igFunnelChart.
The following code, added to the ASP.NET MVC View, configures the igLoader’s wrapper with the paths to the Ignite UI for jQuery resources.
In ASPX:
 @(Html.Infragistics()
     .Loader()
     .ScriptPath("http://localhost/ig_ui/js/")
     .CssPath("http://localhost/ig_ui/css/")
     .Render()
 )
The code below configures Ignite UI for MVC FunnelChart to create a <div> element with id “funnel” where the funnel chart is to be hosted with the ID(“funnel”) call and assigns the data model object declared for the View to the control in the FunnelChart(Model) call. The member of the model which provides the value for every slice is referenced in the ValueMemberPath("Budget") calls.
In ASPX:
 @(Html.Infragistics().FunnelChart(Model)
     .ID("funnel")
     .Height("450px")
     .Width("325px")
     .ValueMemberPath("Budget")
     .InnerLabelMemberPath("Budget")
     .OuterLabelMemberPath("Department")
     .InnerLabelVisibility(Visibility.Visible)
     .OuterLabelVisibility(Visibility.Visible)
     .DataBind()
     .Render()
 )
The Width() and Height() calls specify the size of the chart on the page and their values can be specified in any unit of measure available in CSS.
The InnerLabelMemberPath() and OuterLabelMemberPath() calls configure the names of the fields in the data source which contain labels or names to render for every slice.
The InnerLabelVisibility()
and OuterLabelVisibility() calls determine whether inner and outer labels render. Inner label is the text displayed inside a slice and outer label is the text displayed to left or right of the slice.
(Optional) Verifying the result.
To verify the result, save the page and view the final result in a web browser. If you have done the steps correctly, the map will look like the one shown in the Preview.
The following topics provide additional information related to this topic.
igFunnelChart Overview: This topic provides conceptual information about the igFunnelChart control including its main features, minimum requirements, and user functionality.
Binding igFunnelChart to Data: This topic explains how to bind the igFunnelChart control to various data sources.
Configuring igFunnelChart: This topic explains how to configure different visual features and behavior of the igFunnelChart control.
Styling igFunnelChart: This topic explains how to customize the look-and-feel of the igFunnelChart control.
Accessibility Compliance (igFunnelChart): This topic explains the igFunnelChart control’s accessibility features and provides advice on how to achieve accessibility compliance for pages containing charts.
Known Issues and Limitations (igFunnelChart): This topic lists the known issues related to the igFunnelChart control.
jQuery and MVC API Links (igFunnelChart): This topic lists the links to the API reference documentation for the igFunnelChart control.
The following samples provide additional information related to this topic.
View on GitHub