
This topic covers samples with Ignite UI for jQuery controls and TypeScript.
This topic contains the following sections:
In order to run these samples, you need to have:
This sample will demonstrate how we can use igGrid with TypeScript.
The following screenshot is a preview of the final result.

This sample will demonstrate how to use TypeScript for creating igGrid and features like Paging, Filtering and Sorting.
In HTML:
<table id="grid1"></table>
We use the adventureWorks data source to populate the igGrid.
var adventureWorks = [
    { "ProductID": 1, "Name": "Adjustable Race", "ProductNumber": "AR-5381", "MakeFlag": false, "FinishedGoodsFlag": false, "Color": null, "SafetyStockLevel": 1000, "ReorderPoint": 750, "StandardCost": 0.0000, "ListPrice": 0.0000, "Size": null, "SizeUnitMeasureCode": null, "WeightUnitMeasureCode": null, "Weight": null, "DaysToManufacture": 0, "ProductLine": null, "Class": null, "Style": null, "ProductSubcategoryID": null, "ProductModelID": null, "SellStartDate": "\/Date(896648400000)\/", "SellEndDate": null, "DiscontinuedDate": null, "rowguid": "694215b7-08f7-4c0d-acb1-d734ba44c0c8", "ModifiedDate": "\/Date(1078992096827)\/" },
    { "ProductID": 2, "Name": "Bearing Ball", "ProductNumber": "BA-8327", "MakeFlag": false, "FinishedGoodsFlag": false, "Color": null, "SafetyStockLevel": 1000, "ReorderPoint": 750, "StandardCost": 0.0000, "ListPrice": 0.0000, "Size": null, "SizeUnitMeasureCode": null, "WeightUnitMeasureCode": null, "Weight": null, "DaysToManufacture": 0, "ProductLine": null, "Class": null, "Style": null, "ProductSubcategoryID": null, "ProductModelID": null, "SellStartDate": "\/Date(896648400000)\/", "SellEndDate": null, "DiscontinuedDate": null, "rowguid": "58ae3c20-4f3a-4749-a7d4-d568806cc537", "ModifiedDate": "\/Date(1078992096827)\/" } ...
]
We initialize the grid in TypeScript.
In TypeScript:
/// <reference path="http://www.igniteui.com/js/typings/jqueryui.d.ts" />
/// <reference path="http://www.igniteui.com/js/typings/jquery.d.ts" />
/// <reference path="http://www.igniteui.com/js/typings/igniteui.d.ts" />
declare var adventureWorks: any;
$(function () {
    $("#grid1").igGrid({
        width: "100%",
        columns: [
            { headerText: "Product ID", key: "ProductID", dataType: "number", width: "15%" },
            { headerText: "Product Name", key: "Name", dataType: "string", width: "40%" },
            { headerText: "Product Number", key: "ProductNumber", dataType: "string", width: "30%" },
            { headerText: "Make Flag", key: "MakeFlag", dataType: "bool", width: "15%" }
        ],
        dataSource: adventureWorks,
        features: [
            {
                name: "Paging"
            },
            {
                name: "Sorting"
            },
            {
                name: "Filtering"
            }
        ],
    });
});
This sample will demonstrate how we can use igEditors with TypeScript.
The following screenshot is a preview of the final result.
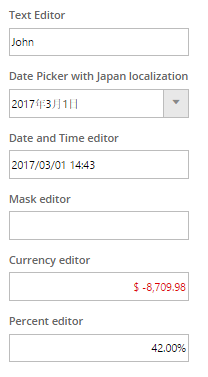
Create the HTML - we are going to have different editors - Text Editor, Date Editor, Date Picker with Localization, Mask Editor, Currency Editor and Percent Editor.
In HTML:
<div id="editors">
    <div>
        <h4>
            Text Editor
        </h4>
        <div id="textEditor"></div>
    </div>
    <div>
        <h4>
            Date Picker with Japan localization
        </h4>
        <div id="jaDatePicker"></div>
    </div>
    <div>
        <h4>
            Date and Time editor
        </h4>
        <div id="dateTimeEditor"></div>
    </div>
    <div>
        <h4>
            Mask editor
        </h4>
        <div id="maskEditor"></div>
    </div>
    <div>
        <h4>
            Currency editor
        </h4>
        <div id="currencyEditor"></div>
    </div>
    <div>
        <h4>
            Percent editor
        </h4>
        <div id="percentEditor"></div>
    </div>
</div>
We initialize the editors in TypeScript. In TypeScript:
/// <reference path="http://www.igniteui.com/js/typings/jquery.d.ts" />
/// <reference path="http://www.igniteui.com/js/typings/jqueryui.d.ts" />
/// <reference path="http://www.igniteui.com/js/typings/igniteui.d.ts" />

$(function () {
    $("#textEditor").igTextEditor({
        width: "200",
        value: "John"
    });

    $("#dateTimeEditor").igDateEditor({
        width: "200",
        dateInputFormat: "dateTime",
        value: new Date()
    });

    $("#jaDatePicker").igDatePicker({
        width: "200",
        value: new Date(),
        readOnly: true,
        dropDownOnReadOnly: true,
        dateDisplayFormat: "dateLong",
        regional: "ja"
    });

    $("#currencyEditor").igCurrencyEditor({
        width: "200",
        value: -8709.98,
        negativePattern: "$ -n",
        positivePattern: "$ n",
        regional: "en-US"
    });

    $("#maskEditor").igMaskEditor({
        width: "200",
        inputMask: 'AaaL/aa',
        dataMode: 'rawTextWithRequiredPromptsAndLiterals'
    });

    $("#percentEditor").igPercentEditor({
        width: "200",
        value: "42",
        displayFactor: 1
    });
});
This sample will demonstrate how we can use igTileManager with TypeScript.
The following screenshot is a preview of the final result.
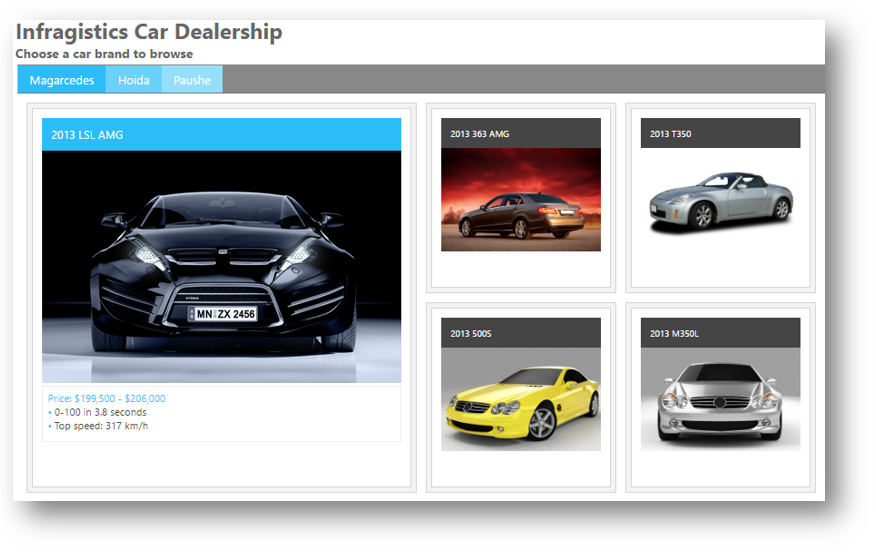
Create the HTML - we are going to have three tabs with car brands and an igTileManager which will load photos of the selected car brand.
In HTML:
<h1 class="hOne">Infragistics Car Dealership</h1>
<h3>Choose a car brand to browse</h3>
<div id="car-tabs">
    <ul>
        <li><a href="#magarcedesDashboard">Magarcedes</a></li>
        <li><a href="#hoidaDashboard">Hoida</a></li>
        <li><a href="#pausheDashboard">Paushe</a></li>
    </ul>

    <div id="magarcedesDashboard" class="dashboard"></div>
    <div id="hoidaDashboard" class="dashboard"></div>
    <div id="pausheDashboard" class="dashboard"></div>
</div>
Create the Data Source - we are adding the classes CarData and Info, and initialize the three car brands data. We are storing everything in the Cars array.
In TypeScript:
/// <reference path="../../js/typings/jquery.d.ts" />
/// <reference path="../../js/typings/jqueryui.d.ts" />
/// <reference path="../../js/typings/igniteui.d.ts" />

class Info {
    description: string
    constructor(_description: string) {
        this.description = _description;
    }
}

class CarData {
    name: string;
    picture: string;
    priceRange: string;
    extras: Info[];
    constructor(_name: string, _picture: string, _priceRange: string, _extras: Info[]) {
        this.name = _name;
        this.picture = _picture;
        this.priceRange = _priceRange;
        this.extras = _extras;
    }

    addExtra(_extra) {
        this.extras.push(_extra);
    }
}

var Magarcedes: CarData[] = [];
Magarcedes.push(new CarData("2013 LSL AMG", "../../images/samples/tile-manager/car-dealership/shutterstock_139519967.jpg",
    "$199,500 - $206,000", [new Info("0-100 in 3.8 seconds"), new Info("Top speed: 317 km/h")]));
...

var Hoida: CarData[] = [];
Hoida.push(new CarData("2013 Candy", "../../images/samples/tile-manager/car-dealership/shutterstock_57034834.jpg",
    "$21,661 - $29,404", [new Info("Gas I4 2.5L engine"), new Info("Highway fuel efficiency 35 mpg")]));
...

var Paushe: CarData[] = [];
Paushe.push(new CarData("2013 CST", "../../images/samples/tile-manager/car-dealership/shutterstock_38288989.jpg",
    "$39,095 - $59,090", [new Info("Available All Wheel Drive"), new Info("Available touch-screen glide-up navigation with voice recognition"),
        new Info("Leather seating surfaces"), new Info("Adaptive Remote Start")]));
...

var Cars: CarData[][] = [];
Cars.push(Magarcedes);
Cars.push(Hoida);
Cars.push(Paushe);
Create the igTileManager - we are creating the igTileManager and the tabs. Then we preselect the first car brand and set the tabs to update the igTileManager data source when a tab is selected.
In TypeScript:
$(function () {
    var activated: boolean[] = [false, false, false, false],
    options: IgTileManager = {
            columnWidth: 210,
            columnHeight: 210,
            marginLeft: 10,
            marginTop: 10,
            dataSource: Cars,
            items: [
                { rowIndex: 0, colIndex: 0, rowSpan: 2, colSpan: 2 },
                { rowIndex: 0, colIndex: 2, rowSpan: 1, colSpan: 1 },
                { rowIndex: 1, colIndex: 2, rowSpan: 1, colSpan: 1 },
                { rowIndex: 2, colIndex: 0, rowSpan: 1, colSpan: 1 },
                { rowIndex: 2, colIndex: 1, rowSpan: 1, colSpan: 1 },
                { rowIndex: 2, colIndex: 2, rowSpan: 1, colSpan: 1 }
            ],
            maximizedTileIndex: 0,
            maximizedState: '<figure><figcaption>${name}</figcaption><img src="${picture}" title="${Name}" alt="error" /></figure><ul><li>Price: ${priceRange}</li>' +
            '{{each ${extras} }}<li>${extras.description}</li>{{/each}}</ul>',
            minimizedState: '<figure><figcaption>${name}</figcaption><img src="${picture}" title="${Name}" alt="error" />'
        };

    // First time initialization of the tab that will be shown on page load
    options.dataSource = Cars[0];
    activated[0] = true;
    $('#magarcedesDashboard').igTileManager(options);

    var tabOptions: JQueryUI.TabsOptions = {
        activate: function (event, ui) {
            var index = ui.newTab.index();
            if (!activated[index]) {
                options.dataSource = Cars[index];
                ui.newPanel.igTileManager(options);
                activated[index] = true;
            } else {
                ui.newPanel.igTileManager('reflow');
            }
        }
    }

    $('#car-tabs').tabs(tabOptions);
});
This sample will demonstrate how we can use igDialog with TypeScript
The following screenshot is a preview of the final result.

Create the HTML - we are going to show the Infragistics' site inside the igDialog.
In HTML:
<button id="openDialog"></button>

    <div id="dialog">
            <iframe src="http://www.infragistics.com" frameborder="0" width= "100%" height="100%"></iframe>
    </div>
Create the igDialog - we are creating the igDialog in closed state. Then we attach an event handler function for the click event to the button so that the modal dialog window will open when the button is clicked.
In TypeScript:
$(function () {

    // Initialize the open button with igButton
    $("#openDialog").igButton({ labelText: "Open Dialog" });

    // Initialize the igDialog
    $("#dialog").igDialog({
        state: "closed",
        modal: true,
        draggable: false,
        resizable: false,
        height: 500,
        width: 400
    });

    $("#openDialog").on({
        click: function (e) {
            // Open the igDialog
            $("#dialog").igDialog("open");
        }
    });
});
This sample will demonstrate how we can use the igTemplatingEngine with TypeScript
The following screenshot is a preview of the final result.
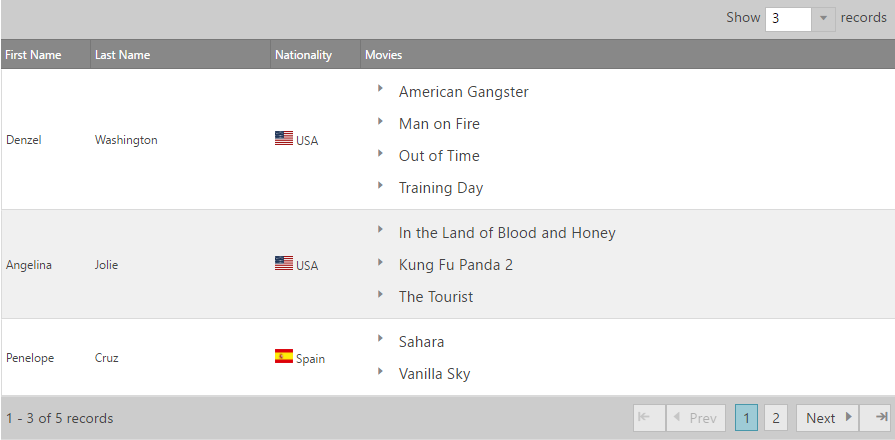
Create the HTML - This sample demonstrates how to use nested templates using the Infragistics Templating Engine in TypeScript. In this example the movies collection for each actor is iterated through and a Tree is used to display the movies data.
In HTML:
<script id="colTmpl" type="text/template"></script>
<div id="resultGrid"></div>
We are adding the classes Movie and Actor, and initialize the movies and actors data.
In TypeScript:
/// <reference path="http://www.igniteui.com/js/typings/jquery.d.ts" />
/// <reference path="http://www.igniteui.com/js/typings/jqueryui.d.ts" />
/// <reference path="http://www.igniteui.com/js/typings/igniteui.d.ts" />

class Movie {
    name: string;
    year: number;
    genre: string;
    rating: number;
    languages: string;
    subtitles: string;
    constructor(inName: string, inYear: number, inGenre: string, inRating: number, inLanguage: string, inSubs: string) {
        this.name = inName;
        this.year = inYear;
        this.genre = inGenre;
        this.rating = inRating;
        this.languages = inLanguage;
        this.subtitles = inSubs;
    }
}

class Actor {
    firstName: string;
    lastName: string;
    nationality: Object;
    movies: Movie[];
    constructor(inFirstName: string, inLastName: string, inNationality: Object, inMoviesArray: Movie[]) {
        this.firstName = inFirstName;
        this.lastName = inLastName;
        this.nationality = inNationality;
        this.movies = inMoviesArray;
    }
}

var moviesDWashington: Movie[] = [];
moviesDWashington.push(new Movie("American Gangster", 2007, "Biography, Crime, Drama", 7.9, "English, German", "Japanese, English"));

var moviesAJolie: Movie[] = [];
moviesAJolie.push(new Movie("In the Land of Blood and Honey", 2011, "Drama, Romance, War", 3.2, "English", "English, French"));

var moviesPCruz: Movie[] = [];
moviesPCruz.push(new Movie("Sahara", 2005, "Action, Adventure, Comedy", 5.9, "English, Spanish", "Japanese, French"));

var moviesGClooney: Movie[] = [];
moviesGClooney.push(new Movie("Ocean's Thirteen", 2007, "Crime, Thriller", 6.9, "English", "Spanish, French"));

var moviesJRoberts: Movie[] = [];
moviesJRoberts.push(new Movie("Eat Pray Love", 2010, "Drama, Romance", 5.3, "English, German", "Spanish, French"));

var actors: Actor[] = [];
actors.push(new Actor("Denzel", "Washington", { key: "USA", value: "USA" }, moviesDWashington));
After that we initialize the igGrid and the igTree controls
In TypeScript:
$(function () {
    var i = 0, currentValue, limit,
        imagesRoot = "http://www.igniteui.com/images/samples/templating-engine/multiConditionalColTemplate";

    $("#resultGrid").igGrid({
        dataSource: actors,
        width: "100%",
        autoGenerateColumns: false,
        columns: [
            { headerText: "First Name", key: "firstName", width: 100 },
            { headerText: "Last Name", key: "lastName", width: 200 },
            { headerText: "Nationality", key: "nationality", width: 100, template: "<img width='20' height='15' src='" + imagesRoot + "/${nationality.key}.gif' /> ${nationality.value} " },
            { headerText: "Movies", key: "movies", width: 500, template: $("#colTmpl").html() },
        ],
        rendered: function () {
            initializeInnerControls();
        },
        features: [
            {
                name: "Paging",
                type: "local",
                pageSize: 3,
                pageSizeChanged: function () {
                    initializeInnerControls();
                },
                pageIndexChanged: function () {
                    initializeInnerControls();
                }
            }
        ]
    });

    function initializeInnerControls() {
        $(".tree").igTree({ hotTracking: false });
        limit = $('.rating').length;
        for (i = 0; i < limit; i++) {
            currentValue = parseFloat($($('.rating')[i]).html());
            $($('.rating')[i]).igRating({
                voteCount: 10,
                value: currentValue,
                valueAsPercent: false,
                precision: "exact"
            });
        }
    }
});
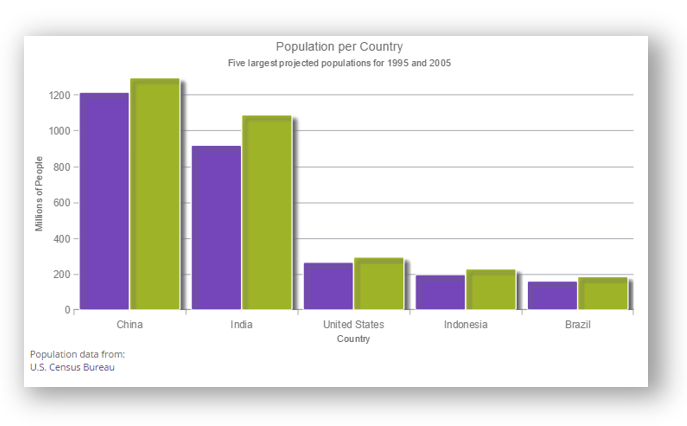
This sample demonstrates how to create Data Chart in TypeScript using class-based approach for configuring data.
The following screenshot is a preview of the final result.
Create the HTML In HTML:
<div id="data-chart"></div>

<div class="USCensus-attribution">
    Population data from:<br>
    <a href="http://www.census.gov/" target="_blank">U.S. Census Bureau</a>
</div>
Create the Data Source abd the igPieChart in TypeScript
In TypeScript:
/// <reference path="http://www.igniteui.com/js/typings/jquery.d.ts" />
/// <reference path="http://www.igniteui.com/js/typings/jqueryui.d.ts" />
/// <reference path="http://www.igniteui.com/js/typings/igniteui.d.ts" />

class CountryPopulation {
    countryName: string;
    population2005: number;
    population1995: number;
    constructor(inName: string, populationIn1995: number, populationIn2005: number) {
        this.countryName = inName;
        this.population2005 = populationIn2005;
        this.population1995 = populationIn1995;
    }

}

var samplePopulation: CountryPopulation[] = [];
samplePopulation.push(new CountryPopulation("China", 1216,  1297));
samplePopulation.push(new CountryPopulation("India", 920, 1090));
samplePopulation.push(new CountryPopulation("United States", 266, 295));
samplePopulation.push(new CountryPopulation("Indonesia", 197, 229));
samplePopulation.push(new CountryPopulation("Brazil", 161, 186));

$(function () {
    $("#data-chart").igDataChart({
        width: "80%",
        height: "400px",
        title: "Population per Country",
        subtitle: "Five largest projected populations for 1995 and 2005",
        dataSource: samplePopulation,
        axes: [
            {
                name: "NameAxis",
                type: "categoryX",
                title: "Country",
                label: "countryName"
            },
            {
                name: "PopulationAxis",
                type: "numericY",
                minimumValue: 0,
                title: "Millions of People",
            }
        ],
        series: [
            {
                name: "1995Population",
                title: "1995",
                type: "column",
                isDropShadowEnabled: true,
                useSingleShadow: false,
                shadowColor: "#666666",
                isHighlightingEnabled: true,
                isTransitionInEnabled: true,
                xAxis: "NameAxis",
                yAxis: "PopulationAxis",
                valueMemberPath: "population1995",
                showTooltip: true
            },
            {
                name: "2005Population",
                title: "2005",
                type: "column",
                isDropShadowEnabled: true,
                useSingleShadow: false,
                shadowColor: "#666666",
                isHighlightingEnabled: true,
                isTransitionInEnabled: true,
                xAxis: "NameAxis",
                yAxis: "PopulationAxis",
                valueMemberPath: "population2005",
                showTooltip: true
            },
            {
                name: "categorySeries",
                type: "categoryToolTipLayer",
                useInterpolation: false,
                transitionDuration: 150
            },
            {
                name: "crosshairLayer",
                title: "crosshair",
                type: "crosshairLayer",
                useInterpolation: false,
                transitionDuration: 500
            }
        ]
    });
})
This sample will demonstrate the use of TypeScript for creating Pie Chart control with a legend and different options for the layout.
The following screenshot is a preview of the final result.
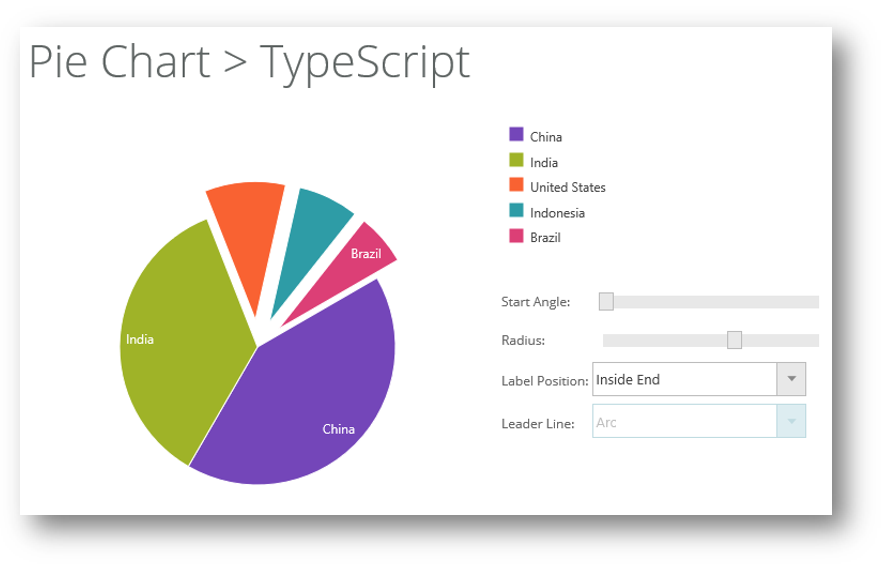
Create the HTML - we are going to create Pie Chart with the ability to set different options for the layout, which includes label positions, lines, angles, radius and legend.
In HTML:
<div id="pieChart"></div>
    <div id="legend"></div>

    <table class="options">
        <tr>
            <td>Start Angle:</td>
            <td>
                <div id="angle" class="slider"></div>
            </td>
        </tr>
        <tr>
            <td>Radius:</td>
            <td>
                <div id="radius" class="slider"></div>
            </td>
        </tr>
        <tr>
            <td>Label Position:</td>
            <td>
                <div class="comboContainer">
                    <select id="labelPosition">
                        <option value="none">None</option>
                        <option value="center">Center</option>
                        <option value="insideEnd">Inside End</option>
                        <option value="outsideEnd" selected="selected">Outside End</option>
                        <option value="bestFit">Best Fit</option>
                    </select>
                </div>
            </td>
        </tr>
        <tr>
            <td>Leader Line:</td>
            <td>
                <div class="comboContainer">
                    <select id="leaderLine">
                        <option value="straight" selected="selected">Straight</option>
                        <option value="arc">Arc</option>
                        <option value="spline">Spline</option>
                    </select>
                </div>
            </td>
        </tr>
    </table>
Create the Data Source - we are adding the class PieChartCountryPopulation, and initialize the country population data. We are storing everything in the PieChartCountryPopulation array.
In TypeScript:
/// <reference path="../../js/typings/jquery.d.ts" />
/// <reference path="../../js/typings/jqueryui.d.ts" />
/// <reference path="../../js/typings/igniteui.d.ts" />

class PieChartCountryPopulation {
    countryName: string;
    population2008: number;
    constructor(inName: string, populationIn2008: number) {
        this.countryName = inName;
        this.population2008 = populationIn2008;
    }
}

var pieChartSample: PieChartCountryPopulation[] = [];
pieChartSample.push(new PieChartCountryPopulation("China", 1333));
pieChartSample.push(new PieChartCountryPopulation("India", 1140));
pieChartSample.push(new PieChartCountryPopulation("United States", 304));
pieChartSample.push(new PieChartCountryPopulation("Indonesia", 228));
pieChartSample.push(new PieChartCountryPopulation("Brazil", 192));
Create the igPieChart - we are creating the igPieChart and all other relevant controls like igCombo and slider in order to configure the layout.
$(function () {
    $('#pieChart').igPieChart({
        dataSource: pieChartSample,
        width: "430px",
        height: "430px",
        dataLabel: 'countryName',
        dataValue: 'population2008',
        explodedSlices: [2, 3, 4],
        radiusFactor: .6,
        startAngle: -30,
        labelsPosition: "outsideEnd",
        leaderLineType: "straight",
        labelExtent: 40,
        legend: { element: 'legend', type: "item" }
    });

    $("#angle").slider({
        slide: function (event, ui) {
            $("#pieChart").igPieChart("option", "startAngle", ui.value);
        },
        min: 0,
        max: 360
    });

    $("#radius").slider({
        slide: function (event, ui) {
            $("#pieChart").igPieChart("option", "radiusFactor", ui.value / 1000.0);
        },
        min: 0,
        max: 1000,
        value: 600
    });

    $("#labelPosition").igCombo({
        enableClearButton: false,
        mode: "dropdown",
        selectionChanged: function (evt, ui) {
            if ($.isArray(ui.items) && ui.items[0] != undefined) {
                $("#pieChart").igPieChart("option", "labelsPosition", ui.items[0].data.value);

                $("#labelExtent").slider("option", "disabled", ui.items[0].data.value != "outsideEnd");
                $("#leaderLine").igCombo("option", "disabled", ui.items[0].data.value != "outsideEnd" ? true : false);
            }
        }
    });

    $("#leaderLine").igCombo({
        enableClearButton: false,
        mode: "dropdown",
        selectionChanged: function (evt, ui) {
            if ($.isArray(ui.items) && ui.items[0] != undefined) {
                $("#pieChart").igPieChart("option", "leaderLineType", ui.items[0].data.value);
            }
        }
    });
});
This sample will demonstrate how we can use igTree with TypeScript.
The following screenshot is a preview of the final result.
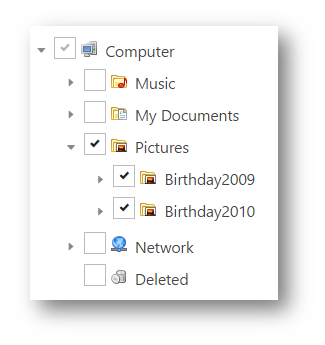
Create the HTML - we are going to create an igTree will represent a file explorer consisting of folders and files.
In HTML:
<div id="tree"></div>
Create the Data Source - we are creating a hierarchical structure consisting of folders, subfolders and files.
In TypeScript:
/// <reference path="../../js/typings/jquery.d.ts" />
/// <reference path="../../js/typings/jqueryui.d.ts" />
/// <reference path="../../js/typings/igniteui.d.ts" />

class FileType {
    name: string;
    type: string;
    imageUrl: string;
    folder: FileType[];
    constructor(inName: string, inType: string, inImageUrl: string, inFolder: FileType[]) {
        this.name = inName;
        this.type = inType;
        this.imageUrl = inImageUrl;
        this.folder = inFolder;
    }
}

function createSubfolderFiles(parentFolder: FileType, subFolders: string[], files: string[][],
    folderPicture: string, filePicture: string) {
    var fileIndex, subFolderIndex;
    for (subFolderIndex = 0; subFolderIndex < subFolders.length; subFolderIndex++) {
        parentFolder.folder.push(new FileType(subFolders[subFolderIndex], "Folder", folderPicture, []));

        for (fileIndex = 0; fileIndex < files[subFolderIndex].length; fileIndex++) {
            parentFolder.folder[subFolderIndex].folder.push(new FileType(files[subFolderIndex][fileIndex], "File", filePicture, []));
        }
    }
}

var folderMusic = new FileType("Music", "Folder", "../../images/samples/tree/book.png", []);
var musicSubFolders = ["Y.Malmsteen", "WhiteSnake", "AC/DC", "Rock"];
var musicFiles = [["Making Love", "Rising Force", "Fire and Ice"], ["Trouble", "Bad Boys", "Is This Love"],
    ["ThunderStruck", "T.N.T.", "The Jack"], ["Bon Jovi - Always"]];
createSubfolderFiles(folderMusic, musicSubFolders, musicFiles, "../../images/samples/tree/book.png", "../../images/samples/tree/music.png");

...

var folderDeleted = new FileType("Deleted", "Folder", "../../images/samples/tree/bin_empty.png", []);
var folderComputer = new FileType("Computer", "Folder", "../../images/samples/tree/computer.png", []);
folderComputer.folder.push(folderMusic);
folderComputer.folder.push(folderDocuments);
folderComputer.folder.push(folderPictures);
folderComputer.folder.push(folderNetwork);
folderComputer.folder.push(folderDeleted);

var files = [folderComputer];
Create the igTree - we are creating the igTree and binding it to the generated data source.
In TypeScript:
$(function () {
    var options: IgTree = {
        checkboxMode: 'triState',
        singleBranchExpand: true,
        dataSource: $.extend(true, [], files),
        initialExpandDepth: 0,
        pathSeparator: '.',
        bindings: {
            textKey: 'name',
            valueKey: 'type',
            imageUrlKey: 'imageUrl',
            childDataProperty: 'folder'
        },
        dragAndDrop: true,
        dragAndDropSettings: {
            allowDrop: true,
            customDropValidation: function (element) {
                // Validates the drop target
                var valid = true,
                    droppableNode = $(this);

                if (droppableNode.is('a') && droppableNode.closest('li[data-role=node]').attr('data-value') === 'File') {
                    valid = false;
                }

                return valid;
            }
        }
    }

    $("#tree").igTree(options);
});
This sample will demonstrate how to use TypeScript for creating Barcode and how to configure specific settings for it.
The following screenshot is a preview of the final result.
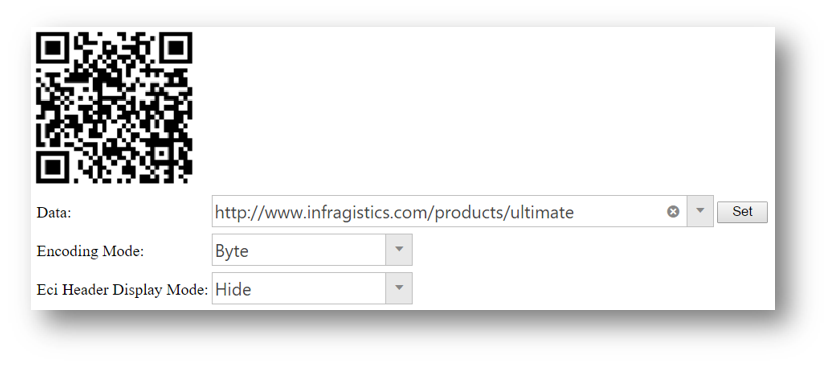
Create the HTML - we are going to create barcode based on some data (in our case hyperlinks to Infragistics website). Encoding mode and Eci Header Display Mode could be used in order to manipulate the barcode modes.
In HTML
<table class="options">
    <tr>
        <td style="text-align:left;">
            <div id="barcode"></div>
        </td>
    </tr>
    <tr>
        <td>Data:</td>
        <td>
            <input id='combo' dir="ltr"></input>
        </td>
        <td>
            <input id="setButton" type="button" value="Set" style="width:50px; float: left;" />
        </td>
    </tr>
    <tr>
        <td>Encoding Mode:</td>
        <td>
            <div class="comboContainer">
                <select id="encodingMode">
                    <option value="undefined">Undefined</option>
                    <option value="numeric">Numeric</option>
                    <option value="alphanumeric">Alphanumeric</option>
                    <option value="byte" selected="selected">Byte</option>
                    <option value="anji">Kanji</option>
                </select>
            </div>
        </td>
    </tr>
    <tr>
        <td>Eci Header Display Mode:</td>
        <td>
            <div class="comboContainer">
                <select id="eciHeaderDisplayMode">
                    <option value="hide" selected="selected">Hide</option>
                    <option value="show">Show</option>
                </select>
            </div>
        </td>
    </tr>
</table>
Create the Data Source - we are adding the class IGProducts and initialize the Infragistics Products data. Everything is stored in the igProductsData array.
In TypeScript
/// <reference path="../../js/typings/jquery.d.ts" />
/// <reference path="../../js/typings/jqueryui.d.ts" />
/// <reference path="../../js/typings/igniteui.d.ts" />

class IGProducts {
    id: number;
    name: string;
    constructor(productId: number, productName: string) {
        this.id = productId;
        this.name = productName;
    }
}

var igProductsData: IGProducts[] = [];
igProductsData.push(new IGProducts(1, "http://www.infragistics.com/products/ultimate"));
igProductsData.push(new IGProducts(2, "http://www.infragistics.com/products/professional"));
igProductsData.push(new IGProducts(3, "http://www.infragistics.com/products/jquery"));
Create the igBarcode - we are creating the igBarcode and all other relevant controls like igCombo in order to help with the layout configuration.
$(function () {
    $("#barcode").igQRCodeBarcode({
        height: "300px",
        width: "100%",
        data: "http://www.infragistics.com/products/jquery/samples",
    });

    $("#dataInput").igTextEditor({
        width: "300px",
        value: "http://www.infragistics.com/products/jquery/help"
    });

    $("#setButton").click(function () {
        $("#barcode").igQRCodeBarcode("option", "data", $("#dataInput").igTextEditor("value"));
    });

    $('#combo').igCombo({
        dataSource: igProductsData,
        textKey: 'Name',
        valueKey: 'ID',
        width: "500px",
        initialSelectedItems: [{
            index: 0
        }]
    });

    $("#encodingMode").igCombo({
        enableClearButton: false,
        mode: "dropdown",
        selectionChanged: function (evt, ui) {
            if ($.isArray(ui.items) && ui.items[0] != undefined) {
                $("#barcode").igQRCodeBarcode("option", "encodingMode", ui.items[0].data.value);
            }
        }
    });

    $("#eciHeaderDisplayMode").igCombo({
        enableClearButton: false,
        mode: "dropdown",
        selectionChanged: function (evt, ui) {
            if ($.isArray(ui.items) && ui.items[0] != undefined) {
                $("#barcode").igQRCodeBarcode("option", "eciHeaderDisplayMode", ui.items[0].data.value);
            }
        }
    });
});
This sample will demonstrate how to configure Layout Manager's Grid Layout and it's ability to have items with arbitrary position in a grid with a predefined size.
The following screenshot is a preview of the final result.
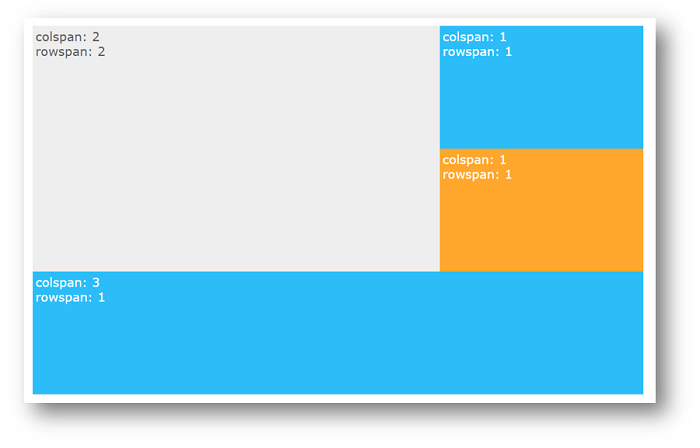
Create the HTML - we are going to create layout manager with Grid layout which can be use to organize content and set different container layout.
In HTML:
..
<style type="text/css">
        ul {
            list-style-type: none;
            font-family: Verdana;
        }

        #layout {
            position: relative;
        }

        .ig-layout-item {
            font-size: 20px;
        }

        @media all and (max-width: 480px) {
            .ig-layout-item {
                font-size: 16px;
            }
        }
    </style>
</head>
<body>
    <div id="layout"></div>
</body>
..
Create the igLayoutManager - different structure of the layout could be configured by changing items and gridLayout options.
In TypeScript:
/// <reference path="../../js/typings/jquery.d.ts" />
/// <reference path="../../js/typings/jqueryui.d.ts" />
/// <reference path="../../js/typings/igniteui.d.ts" />

$(function () {
    options: IgLayoutManager = {
        layoutMode: "grid",
        width: "100%",
        height: "600px",
        gridLayout: { cols: 3, rows: 3 },
        items: [
            { rowSpan: 2, colSpan: 2, colIndex: 0, rowIndex: 0 },
            { rowSpan: 1, colSpan: 1, rowIndex: 0, colIndex: 2 },
            { rowSpan: 1, colSpan: 1, rowIndex: 1, colIndex: 2 },
            { rowSpan: 1, colSpan: 3, colIndex: 0, rowIndex: 2 }
        ],
        itemRendered: function(evt, ui){
            args.item.append("<ul><li>colspan: " + args.itemData.colSpan + "</li><li>rowspan: " + args.itemData.rowSpan + "</li></ul></span>");

            // get the element
            if (args.itemData.colSpan == 2 && args.itemData.rowSpan == 2) {
                args.item.css("background-color", "#eee");
                args.item.css("color", "#555");
            } else if (args.itemData.rowSpan == 1 && args.itemData.colSpan == 1) {
                if (args.itemData.rowIndex == 0) {
                    args.item.css("background-color", "#2CBDF9");
                    args.item.css("color", "#FFF");
                } else {
                    args.item.css("background-color", "#FFA72D");
                    args.item.css("color", "#FFF");
                }
            } else {
                args.item.css("background-color", "#2CBDF9");
                args.item.css("color", "#FFF");
            }
        }
    };

    $('#layout').igLayoutManager(options);
});
This sample will demonstrate how to use TypeScript to create igPivotView and how to assign the data using the class-based approach.
The following screenshot is a preview of the final result.
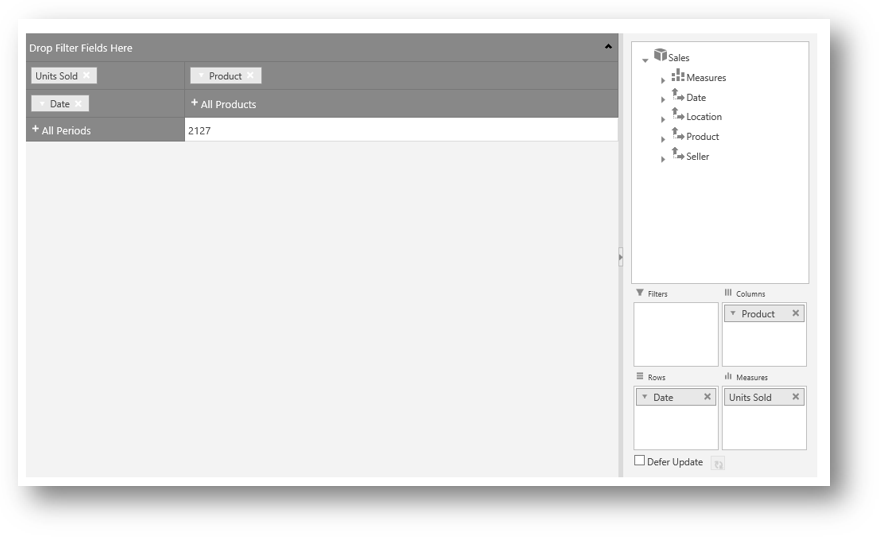
Create the HTML - we are going to create Pivot Grid View composed of three components igPivotGrid, igPivotDataSelector and igSplitter.
In HTML:
<div id="pivotView"></div>
Create the igPivotView - provides in one place needed tools for manipulating multidimensional (OLAP data) in a pivot grid.
In TypeScript:
/// <reference path="../../js/typings/jquery.d.ts" />
/// <reference path="../../js/typings/jqueryui.d.ts" />
/// <reference path="../../js/typings/igniteui.d.ts" />

class SelectorProduct {
    ProductCategory: string;
    SellerName: string;
    Country: string;
    City: string;
    Date: string;
    UnitPrice: number;
    UnitsSold: number;
    constructor(public category, public sellerName, public country, public city,
        public date, public unitPrice, public unitsSold) {
        this.ProductCategory = category;
        this.SellerName = sellerName;
        this.Country = country;
        this.City = city;
        this.Date = date;
        this.UnitPrice = unitPrice;
        this.UnitsSold = unitsSold;
    }
}

var dataView: SelectorProduct[] = [];
dataView.push(new SelectorProduct("Clothing", "Stanley Brooker", "Bulgaria", "Plovdiv", "01/01/2012", 12.81, 282));
dataView.push(new SelectorProduct("Clothing", "Elisa Longbottom", "US", "New York", "01/05/2013", 49.57, 296));
dataView.push(new SelectorProduct("Bikes", "Lydia Burson", "Uruguay", "Ciudad de la Costa", "01/06/2011", 3.56, 68));
dataView.push(new SelectorProduct("Accessories", "David Haley", "UK", "London", "04/07/2012", 85.58, 293));
dataView.push(new SelectorProduct("Components", "John Smith", "Japan", "Yokohama", "12/08/2012", 18.13, 240));
dataView.push(new SelectorProduct("Clothing", "Larry Lieb", "Uruguay", "Ciudad de la Costa", "05/12/2011", 68.33, 456));
dataView.push(new SelectorProduct("Components", "Walter Pang", "Bulgaria", "Sofia", "02/19/2013", 16.05, 492));

function saleValueCalculator(items, cellMetadata) {
        var sum = 0;
        $.each(items, function (index, item) {
            sum += item.UnitPrice * item.UnitsSold;
        });
        return (Math.round(sum * 10) / 10).toFixed(2);
};

dataSource = new $.ig.OlapFlatDataSource({
    dataSource: dataView,
    metadata: {
        cube: {
            name: "Sales",
            caption: "Sales",
            measuresDimension: {
                caption: "Measures",
                measures: [ //for each measure, name and aggregator are required
                    {
                        caption: "Units Sold", name: "UnitsSold",
                        aggregator: $.ig.OlapUtilities.prototype.sumAggregator('UnitsSold')
                    },
                    {
                        caption: "Unit Price", name: "UnitPrice",
                        aggregator: $.ig.OlapUtilities.prototype.sumAggregator('UnitPrice')
                    },
                    {
                        caption: "Sale Value", name: "SaleValue", aggregator: saleValueCalculator
                    }]
            },
            dimensions: [ // for each dimension
                {
                    caption: "Date", name: "Date", /*displayFolder: "Folder1\\Folder2",*/ hierarchies: [
                        $.ig.OlapUtilities.prototype.getDateHierarchy(
                            "Date", // the source property name
                            ["year", "quarter", "month", "date"], // the date parts for which levels will be generated (optional)
                            "Dates", // The name for the hierarchy (optional)
                            "Date", // The caption for the hierarchy (optional)
                            ["Year", "Quarter", "Month", "Day"], // the captions for the levels (optional)
                            "All Periods") // the root level caption (optional)
                    ]
                },
                {
                    caption: "Location", name: "Location", hierarchies: [{
                        caption: "Location", name: "Location", levels: [
                            {
                                name: "AllLocations", caption: "All Locations",
                                memberProvider: function (item) { return "All Locations"; }
                            },
                            {
                                name: "Country", caption: "Country",
                                memberProvider: function (item) { return item.Country; }
                            },
                            {
                                name: "City", caption: "City",
                                memberProvider: function (item) { return item.City; }
                            }]
                    }]
                },
                {
                    caption: "Product", name: "Product", hierarchies: [{
                        caption: "Product", name: "Product", levels: [
                            {
                                name: "AllProducts", caption: "All Products",
                                memberProvider: function (item) { return "All Products"; }
                            },
                            {
                                name: "ProductCategory", caption: "Category",
                                memberProvider: function (item) { return item.ProductCategory; }
                            }]
                    }]
                },
                {
                    caption: "Seller", name: "Seller", hierarchies: [{
                        caption: "Seller", name: "Seller", levels: [
                            {
                                name: "AllSellers", caption: "All Sellers",
                                memberProvider: function (item) { return "All Sellers"; }
                            },
                            {
                                name: "SellerName", caption: "Seller",
                                memberProvider: function (item) { return item.SellerName; }
                            }]
                    }]
                }]
        }
    },

    rows: "[Date].[Dates]",
    columns: "[Product].[Product]",
    measures: "[Measures].[UnitsSold]"
});

$(function () {
    $("#pivotView").igPivotView({
        dataSource: dataSource
    });
});
This sample demonstrates how to use TypeScript to bind database and shape files with countries of the world to the Map control using a geographic shapes series.
The following screenshot is a preview of the final result.
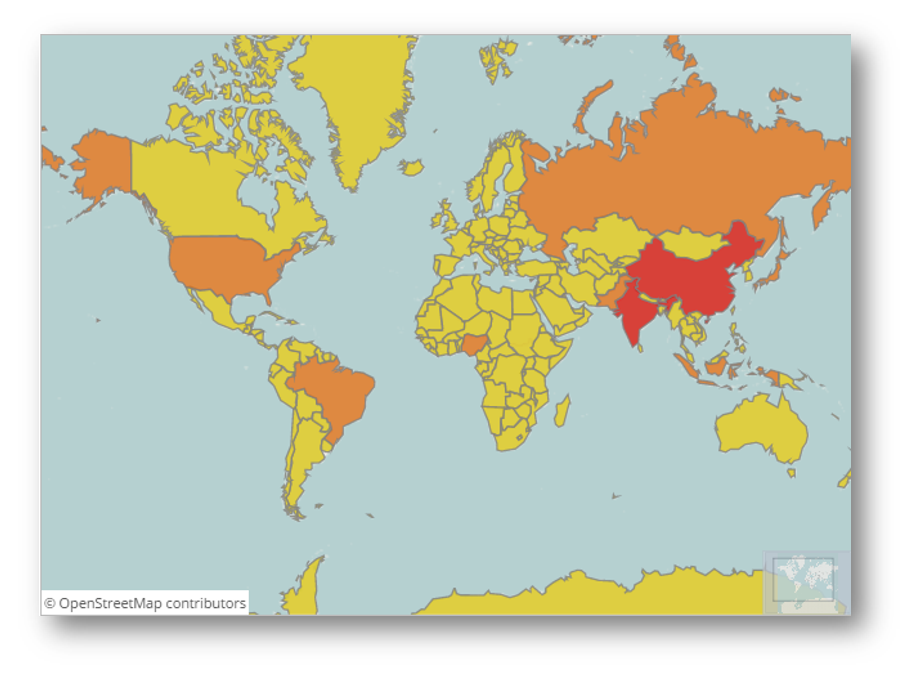
Create the HTML - we are going to create a map that is showing a tooltip when a country is hovered.
In HTML:
<script id="geoShapeTooltip" type="text/x-jquery-tmpl"></script>
<div id="map"></div>
Initialize the igMap and define the geographic shapes series.
In TypeScript:
/// <reference path="http://www.igniteui.com/js/typings/jquery.d.ts" />
/// <reference path="http://www.igniteui.com/js/typings/jqueryui.d.ts" />
/// <reference path="http://www.igniteui.com/js/typings/igniteui.d.ts" />

class ColorPicker {
    brushes: string[];
    interval: number;
    constructor(_min: number, _max: number) {
        this.brushes = ["#d9c616", "#d96f17", "#d1150c"];
        this.interval = (_max - _min) / (this.brushes.length - 1);
    }

    getColorByIndex(val) {
        var index = Math.round(val / this.interval);
        if (index < 0) {
            index = 0;
        } else if (index > (this.brushes.length - 1)) {
            index = this.brushes.length - 1;
        }
        return this.brushes[index];
    }
}

var colorPicker = new ColorPicker(100000, 500000000);

$(function () {
    $("#map").igMap({
        width: "700px",
        height: "500px",
        windowRect: { left: 0.1, top: 0.1, height: 0.7, width: 0.7 },
        overviewPlusDetailPaneVisibility: "visible",
        overviewPlusDetailPaneBackgroundImageUri: "http://www.igniteui.com/images/samples/maps/world.png",
        series: [{
            type: "geographicShape",
            name: "worldCountries",
            markerType: "none",
            shapeMemberPath: "points",
            shapeDataSource: 'http://www.igniteui.com/data-files/shapes/world_countries_reg.shp',
            databaseSource: 'http://www.igniteui.com/data-files/shapes/world_countries_reg.dbf',
            opacity: 0.8,
            outlineThickness: 1,
            showTooltip: true,
            tooltipTemplate: "geoShapeTooltip",
            shapeStyleSelector: {
                selectStyle: function (s, o) {
                    var pop = s.fields.item("POP2005");
                    var popInt = parseInt(pop);
                    var colString = colorPicker.getColorByIndex(popInt); //getColorValue(popInt);
                    return {
                        fill: colString,
                        stroke: "gray"
                    };
                }
            }
        }]
    });
    $("#map").find(".ui-widget-content").append("<span class='copyright-notice'><a href='http://www.openstreetmap.org/copyright'>© OpenStreetMap contributors</a></span>");
});
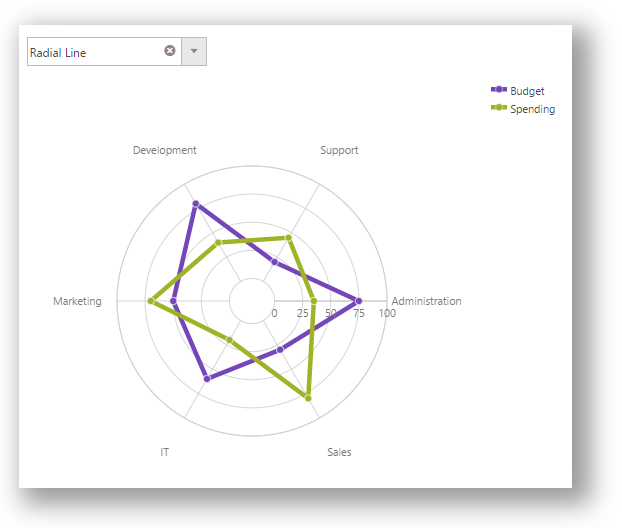
This sample demonstrates how to use TypeScript to load multiple components and features with the Infragistics Loader. Using a Combo Box can be chosen what is the type for the Data Chart that will be displayed. A legend for the Data Chart is included as well.
The following screenshot is a preview of the final result.
Create the HTML.
In HTML:
<div class="selectionOptions">
    <select id="seriesType">
        <option value="radialLine" selected="selected">Radial Line</option>
        <option value="radialColumn">Radial Column</option>
        <option value="radialPie">Radial Pie</option>
    </select>
</div>

<div id="chart"></div>
<div id="legend"></div>
In TypeScript we create the Data, the igLoader, 'igDataChart' and 'igCombo'.
In TypeScript:
/// <reference path="http://www.igniteui.com/js/typings/jquery.d.ts" />
/// <reference path="http://www.igniteui.com/js/typings/jqueryui.d.ts" />
/// <reference path="http://www.igniteui.com/js/typings/igniteui.d.ts" />

class DepartmentData {
    label: string;
    budget: number;
    spending: number;
    constructor(_label: string, _budget: number, _spending: number) {
        this.label = _label;
        this.budget = _budget;
        this.spending = _spending;
    }
}

var companyData: DepartmentData[] = [];
companyData.push(new DepartmentData("Administration", 75, 35));
companyData.push(new DepartmentData("Sales", 30, 80));
companyData.push(new DepartmentData("IT", 60, 20));
companyData.push(new DepartmentData("Marketing", 50, 70));
companyData.push(new DepartmentData("Development", 80, 40));
companyData.push(new DepartmentData("Support", 20, 45));

$.ig.loader({
    scriptPath: "http://www.igniteui.com/igniteui/js/",
    cssPath: "http://www.igniteui.com/igniteui/css/",
    resources: "igDataChart.Radial,igCombo, igChartLegend"
});

// jQuery's ready event can be used with the loader.
// The loader calls holdReady until all JS and CSS files are loaded.
$(function () {

    $("#chart").igDataChart({
        width: "500px",
        height: "500px",
        dataSource: companyData,
        legend: { element: "legend" },
        axes: [{
            name: "angleAxis",
            type: "categoryAngle",
            label: "label",
            interval: 1
        }, {
                name: "radiusAxis",
                type: "numericRadius",
                innerRadiusExtentScale: .1,
                maximumValue: 100,
                minimumValue: 0,
                interval: 25,
                radiusExtentScale: .6
            }],
        series: [{
            name: "series1",
            title: 'Budget',
            type: "radialLine",
            angleAxis: "angleAxis",
            valueAxis: "radiusAxis",
            valueMemberPath: "budget",
            thickness: 5,
            markerType: "circle"
        }, {
                name: "series2",
                title: 'Spending',
                type: "radialLine",
                angleAxis: "angleAxis",
                valueAxis: "radiusAxis",
            valueMemberPath: "spending",
                thickness: 5,
                markerType: "circle"
            }],
        horizontalZoomable: true,
        verticalZoomable: true,
        windowResponse: "immediate"
    });

    $("#seriesType").igCombo({
        selectionChanged: function (evt, ui) {
            if (ui.items[0].data.value != undefined) {
                $("#chart").igDataChart("option", "series", [{
                    name: "series1", remove: true
                }, {
                    name: "series2", remove: true
                }, {
                    name: "series1",
                    title: "Budget",
                    type: ui.items[0].data.value,
                    angleAxis: "angleAxis",
                    valueAxis: "radiusAxis",
                    valueMemberPath: "budget",
                    thickness: 5,
                    markerType: "circle"
                }, {
                    name: "series2",
                    title: 'Spending',
                    type: ui.items[0].data.value,
                    angleAxis: "angleAxis",
                    valueAxis: "radiusAxis",
                    valueMemberPath: "spending",
                    thickness: 5,
                    markerType: "circle"
                }]);
            }
        }
    });
});
The following topic provides additional information related to this one:
Using Ignite UI for jQuery with TypeScript - This topic contains an overview for using the Ignite UI for jQuery type definitions for TypeScript.
View on GitHub