
This topic explains how to configure the tabular View of the OLAP cube result set by arranging the hierarchies of the pivot grid columns, rows, filters, and measures, either from the grid’s interface or programmatically in the code.
Note: The information in this topic is relevant to the following controls:
igOlapFlatDataSource,igOlapXmlaDataSource,igPivotDataSelector,igPivotGrid,igPivotView.
The following topics are prerequisites to understanding this topic:
igOlapXmlaDataSource Overview: This topic provides an overview of the igOlapXmlaDataSource™ component and its main features.
Adding igOlapXmlaDataSource: The topics in this group cover adding the igOlapXmlaDataSource component to an HTML page and an ASP.NET MVC View.
igOlapFlatDataSource Overview: This topic provides an overview of the igOlapFlatDataSource™ component and its main features.
Adding igOlapFlatDataSource: The topics in this group cover adding igOlapFlatDataSource to an HTML page and an ASP.NET MVC View.
igPivotDataSelector Overview: This topic provides conceptual information about the igPivotDataSelector™ control including its main features, minimum requirements, and user functionality.
This topic contains the following sections:
The starting point for performing data analysis of a multi-dimensional (OLAP) data set is presenting the OLAP cube in tabular form with various levels of filtering and aggregation of the data. This filtering and aggregation is based on selecting certain data categories and data aggregation criteria. In a pivot grid, the particular tabular view meeting the desired criteria is achieved through the specific choice and arrangement of the rows, columns, filters, and measures of the grid. This arrangement filters the result set to configure a particular slice based the desired data categories levels of aggregation and display it in tabular view. So specifying and displaying a particular data slice (view) is a matter of configuring (= selecting and arranging) the hierarchies for the rows, columns, filters, and measures.
In the Ignite UI for jQuery™ OLAP components, the configuring of these hierarchies can be done on the following levels:
igPivotDataSelector, igPivotGrid™, igPivotView™) (user configuration)igOlapFlatDataSource or igOlapXmlaDataSource API, which can be:The following table provides an overview of the existing ways to configure a particular tabular view of the result set in a pivot grid by configuring the grid’s rows, columns, filters.
| Method | Details |
|---|---|
| User Configuration Through the Interface of the Pivot Grid (igPivotDataSelector, igPivotGrid, igPivotView) | Users can configure the desired tabular view by the selecting hierarchies and measures with drag-and-drop from the user interface of the pivot grid. |
| Programmatic Configuring upon Data Source Initialization (igOlapFlatDataSource, igOlapXmlaDataSource) | You can programmatically configure the tabular view that will be generated when the pivot grid initializes by setting rows, columns, hierarchies, and measures through the initialization options of the data source component. |
| Programmatic Configuring at Run-Time (igOlapFlatDataSource, igOlapXmlaDataSource) | You can programmatically configure the tabular view at run-time by setting rows, columns, hierarchies, and measures through the API of the igOlapFlatDataSource and igOlapXmlaDataSource components. |
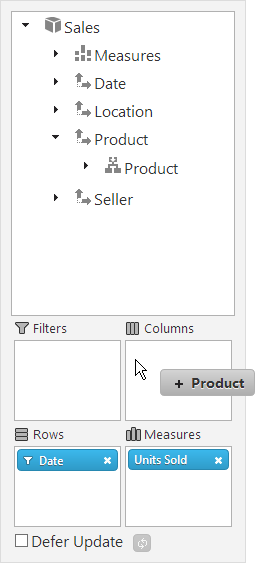
The igPivotDataSelector control (and, respectively, the igPivotView control in which the igPivotDataSelector is internally used) has a user interface that enables selecting and arranging of hierarchies and measures. (The igPivotGrid provides some functionality, (albeit limited). This selecting and arranging is done by dragging items from the metadata tree to the columns, rows, filters, and measures areas beneath it.
The screenshot below demonstrates, an igPivotDataSelector control in which a data slice is being defined and arranged by dragging the Product hierarchy from its metadata tree node to the Columns drop-area. The result of this user action would be the hierarchy being added to the columns collection of the data source and, providing the igPivotGrid is bound to the same data source, the root member(s) of this hierarchy displayed in the column headers area.
The User Interactions and Usability section of the following topics:
By default, all hierarchies are allowed to be dropped to the columns, rows, and filters and all measures can be drag-and-dropped from the metadata tree to the measures area. You can however enforce custom restrictions on this behavior using the customMoveValidation option of the respective OLAP data visualization control (igPivotDataSelector, igPivotGrid, or igPivotView).
You can programmatically configure the tabular view that will be generated when the pivot grid initializes by setting rows, columns, hierarchies, and measures through the initialization options of the data source component. The igOlapFlatDataSource and igOlapXmlaDataSource components support this through a set of properties for specifying the hierarchies and their members to display in the view.
The igOlapFlatDataSource and igOlapXmlaDataSource components have a result property that contains the current view of the data. This property is used by the OLAP data presentation controls (igPivotDataSelector, igPivotGrid, or igPivotView) for displaying the current state of the data source.
To specify the initial hierarchies and/or measures, you need to set the respective properties to the unique names of the hierarchies (= the uniqueName property values).The syntax requirements are:
Note: For
igOlapXmlaDataSource, the unique names are determined by the server’s settings. For igOlapFlatDataSource, the unique name of a hierarchy is generated using the following pattern: [dimensionMetadata.name].[hierarchyMetadata.name]. The unique names of the members are generated using the following pattern:
[dimensionMetadata.name].[hierarchyMetadata.name].[levelMetadata.name].parentMembersPath&[membername] where parentMembersPath is the concatenation of all the names of the members that are parents to the particular member and the &[memberName] pattern is used for all these names. An example for a valid member unique name could be: [Date].[Date].[SaleDateDay].&[2007]&[Q 1]&[January]&[Jan 1]
The following table maps the desired configuration tasks to property settings that set them up.
| In order to: | Use this property: | And set it to: |
|---|---|---|
| Set the column hierarchies | columns |
A string containing comma-separated unique names of the desired hierarchies or measures.
The left-to-right arrangement of the names in the string corresponds to top-to-bottom arrangement of the items in the hierarchy (visualized in igPivotGrid as right-to-left). For example, the following arrangement “[Date].[Date],[Product].[Product]” results
in:
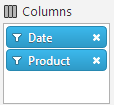 Every hierarchy can be used in any one of the three dimensional roles in the pivot grid: Columns, Rows, Filters.
|
| Set the row hierarchies | rows | |
| Set the filter hierarchies | filters | |
| Set the measures | measures |
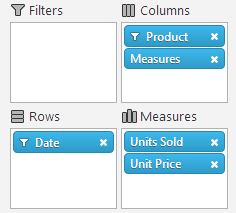
The following code example demonstrates how to setup initial rows, columns, and measures for an igOlapFlatDataSource instance as defined in the Adding igPivotDataSelector to an HTML Page topic. In an igPivotDataSelector control bound to the data source described in that topic, this will display as in the following picture:
In C#:
var dataSource = new $.ig.OlapFlatDataSource({
   //…
   rows: "[Date].[Date]",
   columns: "[Product].[Product]",
   measures: "[Measures].[UnitsSold],[Measures].[UnitPrice]"
});
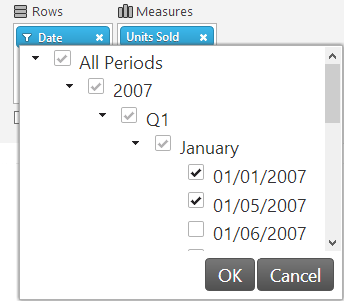
The following snippet specifies the selected members for the Date hierarchy:
In C#:
var dataSource = new $.ig.OlapFlatDataSource({
   //…
   rows: "[Date].[Date]{ [Date].[Date].[SaleDateDay].&[All Periods]&[2007]&[Q 1]&[January]&[Jan 1], [Date].[Date].[SaleDateDay].&[All Periods]&[2007]&[Q 1]&[January]&[Jan 5]}",
   columns: "[Product].[Product]",
   measures: "[Measures].[UnitsSold],[Measures].[UnitPrice]"
});
The result would be as follows:
You can programmatically configure the tabular view at run-time by setting rows, columns, hierarchies, and measures through the API of the igOlapFlatDataSource and igOlapXmlaDataSource components. This API supports the adding and removing items to/from the measures area through a dedicated API.
The following table maps the desired configuration task to the specific methods in the igOlapFlatDataSource and igOlapXmlaDataSource API through which it is achieved.
| In order to: | Use this method: |
|---|---|
| Add an item to columns, rows, filters, or measures | addColumnItem(item) or insertColumnItem(index, item) addRowItem(item) or insertRowItem(index, item) addFilterItem(item) or insertFilterItem(index, item) addMeasureItem(item) or insertMeasureItem(index, item) |
| Remove an item from columns, rows, filters, or measures | removeColumnItem(item) removeRowItem(item) removeFilterItem(item) removeMeasureItem(item) |
The following code example demonstrates how to add and remove an item to/from the columns and measures of an OLAP data source instance using the dataSource identifier.
In JavaScript:
// get a reference to the hierarchy you want to add
var hierarchy = dataSource.getHierarchy("[Date].[Date]");// orvar hierarchy = dataSource.getCoreElement(function (element) { return element.uniqueName() === "[Date].[Date]" }, $.ig.Hierarchy.prototype.getType());

// add it to the columns
dataSource.addColumnItem(hierarchy);
// get a reference to the measure you want to add
var measure = dataSource.getMeasure"[Measures].[UnitsSold]");// orvar measure = dataSource.getCoreElement(function (element) { return element.uniqueName() === "[Measures].[UnitsSold]" }, $.ig.Measure.prototype.getType());
// add it to the measures
dataSource.addMeasureItem(measure);
// update the data source
dataSource.update()
The following samples provide additional information related to this topic.
Binding to Flat Data Source: This sample demonstrates how to bind the igPivotGrid to an igOlapFlatDataSource and uses an igPivotDataSelector for data selection.
Custom Move Validation: This sample shows how to configure custom move validation with the Pivot Grid and the Pivot Data Selector. When using a custom validation function, dropping items to the columns is forbidden. Also any hierarchy that contains the word "Seller" in its name will not be accepted by the drop areas in the Pivot Grid and the Data Selector.
View on GitHub