
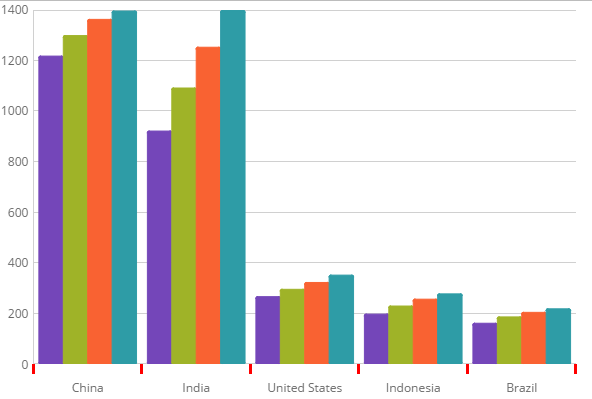
Tick marks display points on the axes. They represent a certain numeric point on a scale or the value of the category in a category axis.
This topic contains the following sections:
In the igCategoryChart™ control, you can change the length, thickness and color of the x-axis and y-axis labels using the following properties:
| Property Name | Property Type | Description |
|---|---|---|
xAxisTickLength, yAxisTickLength |
number | Determines the length of the tickmark along the x-axis or y-axis |
xAxisTickStroke, yAxisTickStroke |
string | Determines the color of the tickmark along the x-axis or y-axis |
xAxisTickStrokeThickness, yAxisTickStrokeThickness |
number | Determines the thickness of of the tickmark along the x-axis or y-axis |
The following code snippet demonstrates how to set the color, length and thickness of the tickmark on the x-axis
In HTML:
$(function () {
            $("#chart").igCategoryChart({
                dataSource: data,
                xAxisTickLength: 10,
                xAxisTickStrokeThickness: 3,
                xAxisTickStroke: 'red'
            });
        });
View on GitHub