
Ignite UI API Reference
ui.igFunnelChart
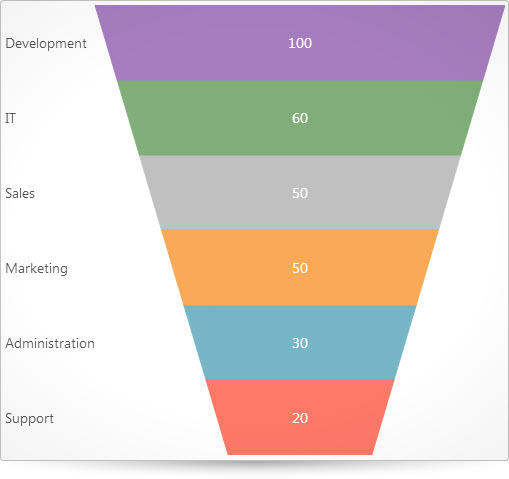
The igFunnelChart™ is a new funnel chart control that displays data in a funnel shape. It displays sections in a top-down composition each representing the data as slices from largest value to the smallest value.
The following code snippet demonstrates how to initialize the igFunnelChart control with column fixing feature.
Click here for more information on how to get started using this API . For details on how to reference the required scripts and themes for the igGrid control read, Using JavaScript Resources in Ignite UI and Styling and Theming Ignite UI.Code Sample
<!doctype html>
<html>
<head>
    <!-- Infragistics Combined CSS -->
    <link href="css/themes/infragistics/infragistics.theme.css" rel="stylesheet" type="text/css" />
    <link href="css/structure/infragistics.css" rel="stylesheet" type="text/css" />
    <!-- jQuery Core -->
    <script src="js/jquery.js" type="text/javascript"></script>
    <!-- jQuery UI -->
    <script src="js/jquery-ui.js" type="text/javascript"></script>
    <!-- Infragistics Combined Scripts -->
    <script src="js/infragistics.core.js" type="text/javascript"></script>
    <script src="js/infragistics.dv.js" type="text/javascript"></script>
    <script type="text/javascript">
        var data = [
            { Budget: 30, Department: "Administration" },
            { Budget: 50, Department: "Sales" },
            { Budget: 60, Department: "IT" },
            { Budget: 50, Department: "Marketing" },
            { Budget: 100, Department: "Development" },
            { Budget: 20, Department: "Support" }
        ];

        $(function () {
            $("#chart").igFunnelChart({
                width: "100%",
                height: "450px",
                dataSource: data,
                valueMemberPath: "Budget",
                innerLabelMemberPath: "Budget",
                innerLabelVisibility: "visible",
                outerLabelMemberPath: "Department",
                outerLabelVisibility: "visible"
            });
        });
    </script>
</head>
<body>
    <div id="chart"></div>
</body>
</html>
Related Samples
Related Topics
Dependencies
Inherits
-
allowSliceSelection
- Type:
- bool
- Default:
- null
Gets or sets whether to allow slices to be selected.
Code Sample
// Initialize $(".selector").igFunnelChart({ allowSliceSelection : true }); // Get var selection = $(".selector").igFunnelChart("option", "allowSliceSelection"); // Set $(".selector").igFunnelChart("option", "allowSliceSelection", true); -
bezierPoints
- Type:
- string
- Default:
- null
Gets or sets values for upper and lower bezier points. That option has effect only when useBezierCurve is enabled.
Value should provide 4 numeric values in range from 0 to 1 separated by space character.
The first number defines upper-x position, second: upper-y, third: lower-x, fourth: lower-y.
The null or invalid value will reset internal default, which is "0.5 0 0.5 1".
Example:
bezierPoints: "0.4 0.1 0.6 1".Code Sample
// Initialize $(".selector").igFunnelChart({ bezierPoints : "0.3 0.1 0.7 1" }); // Get var points = $(".selector").igFunnelChart("option", "bezierPoints"); // Set $(".selector").igFunnelChart("option", "bezierPoints", "0.3 0.1 0.7 1"); -
bottomEdgeWidth
- Type:
- number
- Default:
- 0.35
Gets or sets the percentage (from near 0 to 1) of space the bottom edge of the funnel should take.
Code Sample
// Initialize $(".selector").igFunnelChart({ bottomEdgeWidth : 1 }); // Get var width = $(".selector").igFunnelChart("option", "bottomEdgeWidth"); // Set $(".selector").igFunnelChart("option", "bottomEdgeWidth", 1); -
brushes
- Type:
- object
- Default:
- null
Gets or sets the Brushes property.
The brushes property defines the palette from which automatically assigned brushes are selected.
The value provided should be an array of css color strings or JavaScript objects defining gradients. Optionally the first element can be a string reading "RGB" or "HSV" to specify the interpolation mode of the collection.Code Sample
// Initialize $(".selector").igFunnelChart({ brushes: ["#7DC3D9", "#3e5354", "#9EB5B4", "#5DD1C6", "#AFD1CE", "#2B768E"] }); // Get var brushes = $(".selector").igSparkline("option", "brushes"); // Set $(".selector").igSparkline("option", "brushes", ["#7DC3D9", "#3e5354", "#9EB5B4", "#5DD1C6", "#AFD1CE", "#2B768E"]); -
formatInnerLabel
- Type:
- object
- Default:
- null
Gets or sets the formatter function for inner labels. Function should return string and it takes 3 parameters: 1st-value of item to format, 2nd-index of item within data, 3rd-reference to igFunnelChart.
Code Sample
function formatFunction(val) { return "Label: " + val; }; // Initialize $(".selector").igFunnelChart({ formatInnerLabel : formatFunction }); // Get var func = $(".selector").igFunnelChart("option", "formatInnerLabel"); // Set $(".selector").igFunnelChart("option", "formatInnerLabel", formatFunction); -
formatOuterLabel
- Type:
- object
- Default:
- null
Gets or sets the formatter function for outer labels. Function should return string and it takes 3 parameters: 1st-value of item to format, 2nd-index of item within data, 3rd-reference to igFunnelChart.
Code Sample
function formatFunction(val) { return "Label: " + val; }; // Initialize $(".selector").igFunnelChart({ formatOuterLabel : formatFunction }); // Get var func = $(".selector").igFunnelChart("option", "formatOuterLabel"); // Set $(".selector").igFunnelChart("option", "formatOuterLabel", formatFunction); -
funnelSliceDisplay
- Type:
- enumeration
- Default:
- null
Gets or sets the how the heights of the funnel slices should be configured.
Members
- uniform
- Type:string
- The slice heights should be uniform.
- weighted
- Type:string
- The slice heights should be weighted by value.
Code Sample
// Initialize $(".selector").igFunnelChart({ funnelSliceDisplay : "uniform" }); // Get var display = $(".selector").igFunnelChart("option", "funnelSliceDisplay"); // Set $(".selector").igFunnelChart("option", "funnelSliceDisplay", "uniform"); -
innerLabelMemberPath
- Type:
- string
- Default:
- null
Gets or sets the InnerLabel mapping property for the current series object.
Code Sample
// Initialize $(".selector").igFunnelChart({ innerLabelMemberPath : "value" }); // Get var path = $(".selector").igFunnelChart("option", "innerLabelMemberPath"); // Set $(".selector").igFunnelChart("option", "innerLabelMemberPath", "value"); -
innerLabelVisibility
- Type:
- enumeration
- Default:
- null
Gets or sets whether the inner labels are visible.
Members
- visible
- Type:string
- .
- collapsed
- Type:string
Code Sample
// Initialize $(".selector").igFunnelChart({ innerLabelVisibility : "visible" }); // Get var visibility = $(".selector").igSparkline("option", "innerLabelVisibility"); // Set $(".selector").igSparkline("option", "innerLabelVisibility", "visible"); -
isInverted
- Type:
- bool
- Default:
- null
Gets or sets if the funnel should be rendered inverted.
Code Sample
// Initialize $(".selector").igFunnelChart({ isInverted : true }); // Get var inverted = $(".selector").igFunnelChart("option", "isInverted"); // Set $(".selector").igFunnelChart("option", "isInverted", true); -
legend
- Type:
- object
- Default:
- null
Gets or sets the Legend for the chart.
The value of that option can be a string with the id of existing html element. That element should be empty and it will be used to create igChartLegend widget.
If element was not found, then new DIV element is created and inserted into parent after chart element.
Value of that option can be an object with member "element", which contains the id of legend-element.
In this case, that object also may contain options supported by the igChartLegend widget, such as "width", "height" and events, such as "legendItemMouseLeftButtonDown", "legendItemMouseEnter", etc.
Examples:
legend: {}
legend: "idOfDiv"
legend: { element: "idOfDiv", width: 300 }
legend: { legendItemMouseLeftButtonDown: function (evt, ui) { ui.chart.toggleSelection(ui.item); } }.Code Sample
// Initialize $(".selector").igFunnelChart({ legend : "legendId" }); // Get var legend = $(".selector").igSparkline("option", "legend"); // Set $(".selector").igSparkline("option", "legend", "legendId"); -
legendItemBadgeTemplate
- Type:
- object
- Default:
- null
Gets or sets the LegendItemBadgeTemplate to use for the legend items.
The provided object should have properties called render and optionally measure. See definition for option: circleMarkerTemplate. -
outerLabelAlignment
- Type:
- enumeration
- Default:
- null
Gets or sets which side of the chart the outer labels should appear.
Members
- left
- Type:string
- The labels will be displayed to the left of the chart.
- right
- Type:string
- The labels will be displayed to the right of the chart.
Code Sample
// Initialize $(".selector").igFunnelChart({ outerLabelAlignment : "left" }); // Get var alignment = $(".selector").igSparkline("option", "outerLabelAlignment"); // Set $(".selector").igSparkline("option", "outerLabelAlignment", "left"); -
outerLabelMemberPath
- Type:
- string
- Default:
- null
Gets or sets the OuterLabel mapping property for the current series object.
Code Sample
// Initialize $(".selector").igFunnelChart({ outerLabelMemberPath : "value" }); // Get var path = $(".selector").igFunnelChart("option", "outerLabelMemberPath"); // Set $(".selector").igFunnelChart("option", "outerLabelMemberPath", "value"); -
outerLabelVisibility
- Type:
- enumeration
- Default:
- null
Gets or sets whether the outer labels are visible.
Members
- visible
- Type:string
- .
- collapsed
- Type:string
Code Sample
// Initialize $(".selector").igFunnelChart({ outerLabelVisibility : "visible" }); // Get var visibility = $(".selector").igSparkline("option", "outerLabelVisibility"); // Set $(".selector").igSparkline("option", "outerLabelVisibility", "visible"); -
outlines
- Type:
- object
- Default:
- null
Gets or sets the Outlines property.
The Outlines property defines the palette from which automatically assigned Outlines are selected.
The value provided should be an array of css color strings or JavaScript objects defining gradients. Optionally the first element can be a string reading "RGB" or "HSV" to specify the interpolation mode of the collection.Code Sample
// Initialize $(".selector").igFunnelChart({ outlines : [ "#3189A6", "#212D2E", "#5C7877", "#2FA498", "#487D78", "#163F4B" ] }); // Get var visibility = $(".selector").igSparkline("option", "outlines"); // Set $(".selector").igSparkline("option", "outlines", [ "#3189A6", "#212D2E", "#5C7877", "#2FA498", "#487D78", "#163F4B" ]); -
outlineThickness
- Type:
- number
- Default:
- -1
Gets or sets the thickness of outline around slices.
Code Sample
// Initialize $(".selector").igFunnelChart({ outlineThickness : 1 }); // Get var thickness = $(".selector").igFunnelChart("option", "outlineThickness"); // Set $(".selector").igFunnelChart("option", "outlineThickness", 1); -
selectedSliceStyle
- Type:
- object
- Default:
- null
Gets or sets the style to use for selected slices.
That can be used to set stroke (outline color), fill (background color) and opacity.Code Sample
// Initialize $(".selector").igFunnelChart({ selectedSliceStyle: { fill: "lightblue", stroke: "black" } }); // Get var style = $(".selector").igFunnelChart("option", "selectedSliceStyle"); // Set $(".selector").igFunnelChart("option", "selectedSliceStyle", { fill: "lightblue", stroke: "black" }); -
transitionDuration
- Type:
- number
- Default:
- 0
Gets or sets how long the animations should take to run.
Code Sample
// Initialize $(".selector").igFunnelChart({ transitionDuration : 1 }); // Get var thickness = $(".selector").igFunnelChart("option", "transitionDuration"); // Set $(".selector").igFunnelChart("option", "transitionDuration", 1); -
unselectedSliceStyle
- Type:
- object
- Default:
- null
Gets or sets the style to use for unselected slices.
That can be used to set stroke (outline color), fill (background color) and opacity.Code Sample
// Initialize $(".selector").igFunnelChart({ unselectedSliceStyle: { fill: "lightblue", stroke: "black" } }); // Get var style = $(".selector").igFunnelChart("option", "unselectedSliceStyle"); // Set $(".selector").igFunnelChart("option", "unselectedSliceStyle", { fill: "lightblue", stroke: "black" }); -
useBezierCurve
- Type:
- bool
- Default:
- null
Gets or sets whether to use a bezier curve to define the funnel.
Code Sample
// Initialize $(".selector").igFunnelChart({ useBezierCurve : true }); // Get var isBezier = $(".selector").igFunnelChart("option", "useBezierCurve"); // Set $(".selector").igFunnelChart("option", "useBezierCurve", true); -
useOuterLabelsForLegend
- Type:
- bool
- Default:
- null
Gets or sets whether to use the outer labels to identify the legend items.
Code Sample
// Initialize $(".selector").igFunnelChart({ useOuterLabelsForLegend : true }); // Get var useLabels = $(".selector").igFunnelChart("option", "useOuterLabelsForLegend"); // Set $(".selector").igFunnelChart("option", "useOuterLabelsForLegend", true); -
useUnselectedStyle
- Type:
- bool
- Default:
- false
Gets or sets whether to use the unselected style on unselected slices.
Code Sample
// Initialize $(".selector").igFunnelChart({ useUnselectedStyle : true }); // Get var useUnselected = $(".selector").igFunnelChart("option", "useUnselectedStyle"); // Set $(".selector").igFunnelChart("option", "useUnselectedStyle", true); -
valueMemberPath
- Type:
- string
- Default:
- null
Gets or sets the value member path for the funnel chart.
Code Sample
// Initialize
$(".selector").igFunnelChart({
    valueMemberPath : "value"
});

// Get
var path = $(".selector").igFunnelChart("option", "valueMemberPath");

// Set
$(".selector").igFunnelChart("option", "valueMemberPath", "value");
For more information on how to interact with the Ignite UI controls' events, refer to
Using Events in Ignite UI.
-
sliceClicked
- Cancellable:
- false
Event which is raised when a slice is clicked.
Function takes first argument null and second argument ui.
Use ui.owner to obtain reference to igFunnelChart.
Use ui.index to obtain index of clicked slice.
Use ui.item to obtain reference to clicked slice item.
Use ui.selected to check if slice became selected.Code Sample
//Delegate
$(document).delegate(".selector", "igfunnelchartsliceclicked", function (evt, ui) {
    // Get reference to igFunnelChart.
    ui.owner;

    // Get index of clicked slice.
    ui.index;

    // Get reference to clicked data item.
    ui.item;

    // Get whether the clicked slice has a selected state.
    ui.selected;
});

// Initialize
$(".selector").igFunnelChart({
    sliceClicked: function(evt, ui) {...}
});
-
destroy
- .igFunnelChart( "destroy" );
Destroys widget.
Code Sample
$(".selector").igFunnelChart("destroy"); -
exportVisualData
- .igFunnelChart( "exportVisualData" );
-
isSelected
- .igFunnelChart( "isSelected", slice:object );
- Return Type:
- bool
- Return Type Description:
- Returns true if slice is selected.
Checks if slice is selected.
- slice
- Type:object
- Index of slice or reference to slice-data-item.
Code Sample
var isSelected = $(".selector").igFunnelChart("isSelected", 1); -
selectedSliceIndexes
- .igFunnelChart( "selectedSliceIndexes", [selection:array] );
Gets sets array of indexes of selected slices.
returnType="array|object" If parameter is undefined, then array of selected indexes is returned. Otherwise, it returns reference to igFunnelChart.- selection
- Type:array
- Optional
- Array or selected slice indexes.
Code Sample
// Get var selected = $(".selector").igFunnelChart("selectedSliceIndexes"); // Set $(".selector").igFunnelChart("selectedSliceIndexes", [0, 1, 4]); -
selectedSliceItems
- .igFunnelChart( "selectedSliceItems", [selection:array] );
Gets array of selected slice items.
returnType="array|object" If parameter is undefined, then array of selected items is returned. Otherwise, it returns reference to igFunnelChart.- selection
- Type:array
- Optional
- Array or selected slice items.
Code Sample
// Get var selected = $(".selector").igFunnelChart("selectedSliceItems"); // Set $(".selector").igFunnelChart("selectedSliceItems", [slice1, slice2, slice3]); -
toggleSelection
- .igFunnelChart( "toggleSelection", slice:object );
- Return Type:
- object
- Return Type Description:
- Returns reference to igFunnelChart.
Toggles selected state of slice.
- slice
- Type:object
- Index of slice or reference to slice-data-item.
Code Sample
$(".selector").igFunnelChart("toggleSelection", 1);
-
ui-funnel ui-corner-all ui-widget-content
- Get the class applied to main element: ui-funnel ui-corner-all ui-widget-content.
-
ui-funnel-tooltip ui-widget-content ui-corner-all
- Get the class applied to the tooltip element: ui-funnel-tooltip ui-widget-content ui-corner-all.