
ui.igDataChart
The igDataChart control is a HTML 5 jQuery chart based on the Infragistics Silverlight Data Visualization xamDataChart™ control. Further information regarding the classes, options, events, methods and themes of this API are available under the associated tabs above.
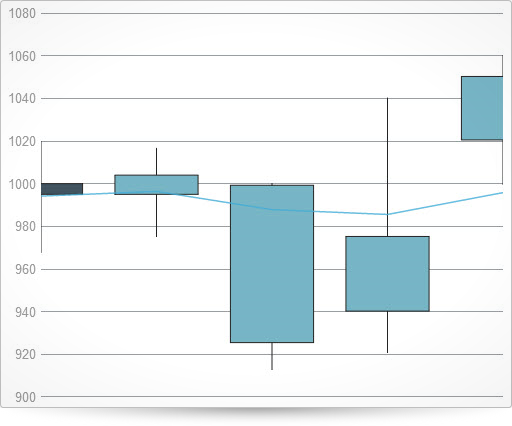
The following code snippet demonstrates how to initialize the igDataChart control.
For details on how to reference the required scripts and themes for the igDataChart control read, Using JavaScript Resources in Ignite UI and Styling and Theming Ignite UI.Code Sample
<!doctype html>
<html>
<head>
    <title>Ignite UI igDataChart</title>
    <!-- Infragistics Combined CSS -->
    <link href="css/themes/infragistics/infragistics.theme.css" rel="stylesheet" type="text/css" />
    <link href="css/structure/infragistics.css" rel="stylesheet" type="text/css" />
    <!-- jQuery Core -->
    <script src="js/jquery.js" type="text/javascript"></script>
    <!-- jQuery UI -->
    <script src="js/jquery-ui.js" type="text/javascript"></script>
    <!-- Infragistics Combined Scripts -->
    <script src="js/infragistics.core.js" type="text/javascript"></script>
	  <script src="js/infragistics.dv.js" type="text/javascript"></script>

    <script type="text/javascript">
        $(function () {
            var data = [
                  { "DateString": "1/1/2010", "Open": 1000, "High": 1019.75, "Low": 967.75, "Close": 995 },
                  { "DateString": "1/2/2010", "Open": 995, "High": 1016.75, "Low": 975, "Close": 1004 },
                  { "DateString": "1/3/2010", "Open": 925.5, "High": 1000.25, "Low": 912.75, "Close": 999.25 },
                  { "DateString": "1/4/2010", "Open": 940.25, "High": 1040.25, "Low": 920.75, "Close": 975.25 },
                  { "DateString": "1/5/2010", "Open": 1020.5, "High": 1060.25, "Low": 999.75, "Close": 1050.25 }
              ];

            $("#chart").igDataChart({
                width: "700px",
                height: "400px",
                axes: [{
                    name: "xAxis",
                    type: "categoryX",
                    dataSource: data,
                    label: "Label",
                    labelVisibility: "collapsed"
                }, {
                    name: "yAxis",
                    type: "numericY",
                    labelVisibility: "visible"
                }],
                series: [{
                    name: "series",
                    dataSource: data,
                    title: "Price Series",
                    type: "financial",
                    xAxis: "xAxis",
                    yAxis: "yAxis",
                    openMemberPath: "Open",
                    highMemberPath: "High",
                    lowMemberPath: "Low",
                    closeMemberPath: "Close",
                    trendLineBrush: "rgba(68, 172, 214, .8)",
                    trendLineType: "exponentialAverage"
                }]
            });
        });
    </script>
</head>
<body>
    <div id="chart"></div>
</body>
</html>
Related Samples
Related Topics
Dependencies
Inherits
-
animateSeriesWhenAxisRangeChanges
- Type:
- bool
- Default:
- false
Set to true in order to override the default behavior in which series do not animate if an axis range changes.
-
autoMarginHeight
- Type:
- number
- Default:
- 0
Sets or gets the automatic height to add when automatically adding margins to the chart.
Code Sample
//Initialize $(".selector").igDataChart({ autoMarginHeight : 100 }); //Get var height = $(".selector").igDataChart("option", "autoMarginHeight"); //Set $(".selector").igDataChart("option", "autoMarginHeight", 100); -
autoMarginWidth
- Type:
- number
- Default:
- 20
Sets or gets the automatic width to add when automatically adding margins to the chart.
Code Sample
//Initialize $(".selector").igDataChart({ autoMarginWidth : 200 }); //Get var width = $(".selector").igDataChart("option", "autoMarginWidth"); //Set $(".selector").igDataChart("option", "autoMarginWidth", 200); -
axes
- Type:
- array
- Default:
- []
- Elements Type:
- object
An array of axis objects.
Code Sample
var data = [{ "Label": "2009", "Item1": "Value1", "Item2": 1000, "Item3": 1019.75}, { "Label": "2010", "Item1": "Value2", "Item2": 1500, "Item3": 1180.25}, { "Label": "2011", "Item1": "Value3", "Item2": 1200, "Item3": 1205.55}, { "Label": "2012", "Item1": "Value4", "Item2": 1450, "Item3": 1144.65}]; // Initialization $(".selector").igDataChart({ axes: [{ name: "xAxis", type: "categoryX", dataSource: data, label: "Label" }, { name: "yAxis", type: "numericY" }] }); // Get var axes = $(".selector").igDataChart("option", "axes"); axes[0]; // access 'xAxis' options axes[1]; // access 'yAxis' options // Set $(".selector").igDataChart("option", "axes", [{ name: "xAxis", type: "categoryX", dataSource: data, label: "Label", labelVisibility: "collapsed" }, { name: "yAxis", type: "numericY", labelVisibility: "collapsed" }] );-
coercionMethods
- Type:
- object
- Default:
- null
Gets or sets the coercion methods to use when loading data from data sources.
Should be specified before setting any member paths, if being used. Setting it later
will not cause data to be reimported into the chart.Code Sample
var data = [ { "Date": new Date(2011, 1, 1), "Value": 1000 }, { "Date": new Date(2011, 1, 2), "Value": 995 }, { "Date": new Date(2011, 1, 3), "Value": 925.5 }, { "Date": new Date(2011, 1, 4), "Value": 940.25 }, { "Date": new Date(2011, 1, 5), "Value": 1020.5 } ]; // Initialization $(".selector").igDataChart({ axes: [{ name: "xAxis", type: "categoryDateTimeX", dataSource: data, dateTimeMemberPath: "Date!parseDate", coercionMethods: { parseDate: function (val) { var newVal = new Date(val); newVal.setDate(newVal.getDate() + 4); return newVal; } } }] }); -
crossingAxis
- Type:
- string
- Default:
- null
Gets or sets the CrossingAxis property.
Code Sample
var data = [{ "Label": "2009", "Item1": "Value1", "Item2": 1000, "Item3": 1019.75}, { "Label": "2010", "Item1": "Value2", "Item2": 1500, "Item3": 1180.25}, { "Label": "2011", "Item1": "Value3", "Item2": 1200, "Item3": 1205.55}, { "Label": "2012", "Item1": "Value4", "Item2": 1450, "Item3": 1144.65}]; // Initialization $(".selector").igDataChart({ axes: [{ name: "xAxis", type: "categoryX", dataSource: data, label: "Label" }, { name: "yAxis", type: "numericY", crossingAxis: "xAxis", crossingValue: 700 }] }); // Get var axes = $(".selector").igDataChart("option", "axes"); axes[1].crossingAxis; // Set $(".selector").igDataChart("option", "axes", [{ name: "xAxis", type: "categoryX", dataSource: data, label: "Label" }, { name: "yAxis", type: "numericY", crossingAxis: "xAxis", crossingValue: 700 }] ); -
crossingValue
- Type:
- object
- Default:
- null
Gets or sets the CrossingValue property.
Code Sample
var data = [{ "Label": "2009", "Item1": "Value1", "Item2": 1000, "Item3": 1019.75}, { "Label": "2010", "Item1": "Value2", "Item2": 1500, "Item3": 1180.25}, { "Label": "2011", "Item1": "Value3", "Item2": 1200, "Item3": 1205.55}, { "Label": "2012", "Item1": "Value4", "Item2": 1450, "Item3": 1144.65}]; // Initialization $(".selector").igDataChart({ axes: [{ name: "xAxis", type: "categoryX", dataSource: data, label: "Label" }, { name: "yAxis", type: "numericY", crossingAxis: "xAxis", crossingValue: 700 }] }); // Get var axes = $(".selector").igDataChart("option", "axes"); axes[1].crossingValue; // Set $(".selector").igDataChart("option", "axes", [{ name: "xAxis", type: "categoryX", dataSource: data, label: "Label" }, { name: "yAxis", type: "numericY", crossingAxis: "xAxis", crossingValue: 700 }] ); -
dataSource
- Type:
- object
- Default:
- null
Can be any valid data source accepted by $.ig.DataSource, or an instance of an $.ig.DataSource itself.
Code Sample
var data = [{ "Label": "2009", "Item1": "Value1", "Item2": 1000, "Item3": 1019.75}, { "Label": "2010", "Item1": "Value2", "Item2": 1500, "Item3": 1180.25}, { "Label": "2011", "Item1": "Value3", "Item2": 1200, "Item3": 1205.55}, { "Label": "2012", "Item1": "Value4", "Item2": 1450, "Item3": 1144.65}]; // Initialization $(".selector").igDataChart({ axes: [{ name: "xAxis", type: "categoryX", dataSource: data, label: "Label" }, { name: "yAxis", type: "numericY" }] }); // Get var axes = $(".selector").igDataChart("option", "axes"); axes[0].dataSource; // Set $(".selector").igDataChart("option", "axes", [{ name: "xAxis", type: "categoryX", dataSource: data, label: "Label" }, { name: "yAxis", type: "numericY" }] ); -
dataSourceType
- Type:
- string
- Default:
- null
Explicitly set data source type (such as "json"). Please refer to the documentation of $.ig.DataSource and its type property.
Code Sample
// Initialization $(".selector").igDataChart({ axes: [{ name: "xAxis", type: "categoryX", dataSource: data, dataSourceType: "json" }] }); // Get var axes = $(".selector").igDataChart("option", "axes"); axes[0].dataSourceType; // Set $(".selector").igDataChart("option", "axes", [{ name: "xAxis", type: "categoryX", dataSource: data, dataSourceType: "json" }] ); -
dataSourceUrl
- Type:
- string
- Default:
- null
Specifies a remote URL accepted by $.ig.DataSource in order to request data from it.
Code Sample
// Initialization $(".selector").igDataChart({ axes: [{ name: "xAxis", type: "categoryX", dataSourceUrl: "http://www.example.com/chart-data" }] }); // Get var axes = $(".selector").igDataChart("option", "axes"); axes[0].dataSourceUrl; // Set $(".selector").igDataChart("option", "axes", [{ name: "xAxis", type: "categoryX", dataSourceUrl: "http://www.example.com/chart-data" }] ); -
dateTimeMemberPath
- Type:
- string
- Default:
- null
Gets or sets the DateTime mapping property for the CategoryDateTimeXAxis.
Code Sample
var data = [{ "Label": "2009", "Item1": "Value1", "Item2": 1000, "Item3": 1019.75}, { "Label": "2010", "Item1": "Value2", "Item2": 1500, "Item3": 1180.25}, { "Label": "2011", "Item1": "Value3", "Item2": 1200, "Item3": 1205.55}, { "Label": "2012", "Item1": "Value4", "Item2": 1450, "Item3": 1144.65}]; // Initialization $(".selector").igDataChart({ axes: [{ name: "xAxis", type: "categoryDateTimeX", dataSource: data, dateTimeMemberPath: "Date" }] }); // Get var axes = $(".selector").igDataChart("option", "axes"); axes[0].dateTimeMemberPath; // Set $(".selector").igDataChart("option", "axes", [{ name: "xAxis", type: "categoryDateTimeX", dataSource: data, dateTimeMemberPath: "Date" }] ); -
displayType
- Type:
- enumeration
- Default:
- null
Gets or sets the axis display type. Continuous display type divides the axis into even intervals, where labels will not necessarily be aligned with data points. Discrete display type will not use a constant interval, but will align each label with its data point.
Members
- continuous
- Type:string
- Points occur at even intervals, even where data is not present at a given point.
- discrete
- Type:string
- Points occur when data is present, possibly at uneven intervals.
Code Sample
// Initialization $(".selector").igDataChart({ axes: [{ name: "xAxis", type: "categoryX", dataSource: data, displayType: "continuous" }] }); // Get var axes = $(".selector").igDataChart("option", "axes"); axes[0].displayType; // Set $(".selector").igDataChart("option", "axes", [{ name: "xAxis", type: "categoryX", dataSource: data, displayType: "continuous" }] ); -
enhancedIntervalMinimumCharacters
- Type:
- number
- Default:
- 5
Gets or sets the mininum desired characters to be displayed for horizontal axes when using advanced label heuristics. -1 will attempt to adjust the interval to precisely fit the horizontal labels.
-
formatLabel
- Type:
- object
- Default:
- null
Sets or gets a function which takes an object that produces a formatted label for displaying in the chart.
Code Sample
var data = [ { "Date": new Date(2011, 1, 1), "Value": 1000 }, { "Date": new Date(2011, 1, 2), "Value": 995 }, { "Date": new Date(2011, 1, 3), "Value": 925.5 }, { "Date": new Date(2011, 1, 4), "Value": 940.25 }, { "Date": new Date(2011, 1, 5), "Value": 1020.5 } ]; // Initialization $(".selector").igDataChart({ axes: [{ name: "xAxis", type: "categoryDateTimeX", dataSource: data, label: "Date", formatLabel: function (item) { var ret = ''; ret += item.getFullYear(); ret += "/"; ret += item.getMonth() + 1; ret += "/"; ret += item.getDate(); return ret; } }] }); -
gap
- Type:
- number
- Default:
- 0
Gets or sets the amount of space between adjacent categories for the current axis object.
The gap is silently clamped to the range [0, 1] when used.Code Sample
// Initialization $(".selector").igDataChart({ axes: [{ name: "xAxis", type: "numericX", gap: 10 }] }); // Get var axes = $(".selector").igDataChart("option", "axes"); axes[0].gap; // Set $(".selector").igDataChart("option", "axes", [{ name: "xAxis", type: "numericX", gap: 10 }] ); -
innerRadiusExtentScale
- Type:
- number
- Default:
- 0
Defines the percentage of the maximum radius extent to leave blank at the center of the chart. Should be
a value between 0.0 and 1.0.Code Sample
// Initialization $(".selector").igDataChart({ axes: [{ name: "xAxis", type: "numericX", innerRadiusExtentScale: 0.15 }] }); // Get var axes = $(".selector").igDataChart("option", "axes"); axes[0].innerRadiusExtentScale; // Set $(".selector").igDataChart("option", "axes", [{ name: "xAxis", type: "numericX", innerRadiusExtentScale: 0.15 }] ); -
interval
- Type:
- number
- Default:
- 0
Gets or sets the frequency of displayed labels.
The set value is a factor that determines which labels will be hidden. For example, an interval of 2 will display every other label.Code Sample
// Initialization $(".selector").igDataChart({ axes: [{ name: "xAxis", type: "numericX", interval: 2 }] }); // Get var axes = $(".selector").igDataChart("option", "axes"); axes[0].interval; // Set $(".selector").igDataChart("option", "axes", [{ name: "xAxis", type: "numericX", interval: 2 }] ); -
isDataPreSorted
- Type:
- bool
- Default:
- false
Gets or sets whether the data assigned to the date time axis should be considered pre-sorted by date/time.
-
isInverted
- Type:
- bool
- Default:
- false
Gets or sets the IsInverted property.
Code Sample
// Initialization $(".selector").igDataChart({ axes: [{ name: "xAxis", type: "numericX", isInverted: true }] }); // Get var axes = $(".selector").igDataChart("option", "axes"); axes[0].isInverted; // Set $(".selector").igDataChart("option", "axes", [{ name: "xAxis", type: "numericX", isInverted: true }] ); -
isLogarithmic
- Type:
- bool
- Default:
- false
Gets or sets the IsLogarithmic property.
Code Sample
// Initialization $(".selector").igDataChart({ axes: [{ name: "xAxis", type: "numericX", isLogarithmic: true }] }); // Get var axes = $(".selector").igDataChart("option", "axes"); axes[0].isLogarithmic; // Set $(".selector").igDataChart("option", "axes", [{ name: "xAxis", type: "numericX", isLogarithmic: true }] ); -
label
- Type:
- object
- Default:
- null
Gets or sets the axis label format string.
Code Sample
var data = [{ "Label": "2009", "Item1": "Value1", "Item2": 1000, "Item3": 1019.75}, { "Label": "2010", "Item1": "Value2", "Item2": 1500, "Item3": 1180.25}, { "Label": "2011", "Item1": "Value3", "Item2": 1200, "Item3": 1205.55}, { "Label": "2012", "Item1": "Value4", "Item2": 1450, "Item3": 1144.65}]; // Initialization $(".selector").igDataChart({ axes: [{ name: "xAxis", type: "categoryX", dataSource: data, label: "Label" }] }); // Get var axes = $(".selector").igDataChart("option", "axes"); axes[0].label; // Set $(".selector").igDataChart("option", "axes", [{ name: "xAxis", type: "categoryX", dataSource: data, label: "Label" }] ); -
labelAngle
- Type:
- number
- Default:
- 0
Specifies the angle that labels on the axis should be rotated.
Code Sample
// Initialization $(".selector").igDataChart({ axes: [{ name: "xAxis", type: "numericX", labelAngle: 30 }] }); // Get var axes = $(".selector").igDataChart("option", "axes"); axes[0].labelAngle; // Set $(".selector").igDataChart("option", "axes", [{ name: "xAxis", type: "numericX", labelAngle: 30 }] ); -
labelBottomMargin
- Type:
- number
- Default:
- 0
The bottom margin to use for the labels.
Code Sample
// Initialization $(".selector").igDataChart({ axes: [{ name: "xAxis", type: "numericX", labelBottomMargin: 10 }] }); // Get var axes = $(".selector").igDataChart("option", "axes"); axes[0].labelBottomMargin; // Set $(".selector").igDataChart("option", "axes", [{ name: "xAxis", labelBottomMargin: 10 }] ); -
labelExtent
- Type:
- number
- Default:
- null
Specifies the extent of the area dedicated to the labels for this axis. If unspecified, this value is auto-calculated.
Code Sample
// Initialization $(".selector").igDataChart({ axes: [{ name: "xAxis", type: "numericX", labelExtent: 10 }] }); // Get var axes = $(".selector").igDataChart("option", "axes"); axes[0].labelExtent; // Set $(".selector").igDataChart("option", "axes", [{ name: "xAxis", type: "numericX", labelExtent: 10 }] ); -
labelHorizontalAlignment
- Type:
- enumeration
- Default:
- right
the horizontal alignment to use for the labels. Only applicable to vertical axes.
Members
- left
- Type:string
- left aligns the labels.
- center
- Type:string
- center aligns the labels.
- right
- Type:string
- right aligns the labels.
Code Sample
// Initialization $(".selector").igDataChart({ axes: [{ name: "yAxis", type: "numericY", labelHorizontalAlignment: "right" }] }); // Get var axes = $(".selector").igDataChart("option", "axes"); axes[0].labelHorizontalAlignment; // Set $(".selector").igDataChart("option", "axes", [{ name: "xAxis", labelHorizontalAlignment: "right" }] ); -
labelLeftMargin
- Type:
- number
- Default:
- 0
The left margin to use for the labels.
Code Sample
// Initialization $(".selector").igDataChart({ axes: [{ name: "xAxis", type: "numericX", labelLeftMargin: 10 }] }); // Get var axes = $(".selector").igDataChart("option", "axes"); axes[0].labelLeftMargin; // Set $(".selector").igDataChart("option", "axes", [{ name: "xAxis", labelLeftMargin: 10 }] ); -
labelLocation
- Type:
- enumeration
- Default:
- null
Specifies the location to display the axis labels for this axis.
Members
- outsideTop
- Type:string
- The labels should have an outside top position.
- outsideBottom
- Type:string
- The labels should have an outside bottom position.
- outsideLeft
- Type:string
- The labels should have an outside left position.
- outsideRight
- Type:string
- The labels should have an outside right position.
- insideTop
- Type:string
- The labels should have an inside top position.
- insideBottom
- Type:string
- The labels should have an inside bottom position.
- insideLeft
- Type:string
- The labels should have an inside left position.
- insideRight
- Type:string
- The labels should have an inside right position.
Code Sample
// Initialization $(".selector").igDataChart({ axes: [{ name: "xAxis", type: "numericX", labelLocation: "outsideBottom" }] }); // Get var axes = $(".selector").igDataChart("option", "axes"); axes[0].labelLocation; // Set $(".selector").igDataChart("option", "axes", [{ name: "xAxis", type: "numericX", labelLocation: "outsideBottom" }] ); -
labelMargin
- Type:
- number
- Default:
- 0
The margin to use for the labels.
Code Sample
// Initialization $(".selector").igDataChart({ axes: [{ name: "xAxis", type: "numericX", labelMargin: 5 }] }); // Get var axes = $(".selector").igDataChart("option", "axes"); axes[0].labelMargin; // Set $(".selector").igDataChart("option", "axes", [{ name: "xAxis", labelMargin: 5 }] ); -
labelRightMargin
- Type:
- number
- Default:
- 0
The right margin to use for the labels.
Code Sample
// Initialization $(".selector").igDataChart({ axes: [{ name: "xAxis", type: "numericX", labelRightMargin: 10 }] }); // Get var axes = $(".selector").igDataChart("option", "axes"); axes[0].labelRightMargin; // Set $(".selector").igDataChart("option", "axes", [{ name: "xAxis", labelRightMargin: 10 }] ); -
labelTextColor
- Type:
- string
- Default:
- null
Overrides the color of the text used for the axis labels.
Code Sample
// Initialization $(".selector").igDataChart({ axes: [{ name: "xAxis", type: "numericX", labelTextColor: "blue" }] }); // Get var axes = $(".selector").igDataChart("option", "axes"); axes[0].labelTextColor; // Set $(".selector").igDataChart("option", "axes", blue [{ name: "xAxis", type: "numericX", labelTextColor: "blue" }] ); -
labelTextStyle
- Type:
- string
- Default:
- null
Overrides the style of the text used for the axis labels.
Code Sample
// Initialization $(".selector").igDataChart({ axes: [{ name: "xAxis", type: "numericX", labelTextStyle: "8pt Helvetica, Arial, sans-serif" }] }); // Get var axes = $(".selector").igDataChart("option", "axes"); axes[0].labelTextStyle; // Set $(".selector").igDataChart("option", "axes", blue [{ name: "xAxis", type: "numericX", labelTextStyle: "8pt Helvetica, Arial, sans-serif" }] ); -
labelTopMargin
- Type:
- number
- Default:
- 0
The top margin to use for the labels.
Code Sample
// Initialization $(".selector").igDataChart({ axes: [{ name: "xAxis", type: "numericX", labelTopMargin: 10 }] }); // Get var axes = $(".selector").igDataChart("option", "axes"); axes[0].labelTopMargin; // Set $(".selector").igDataChart("option", "axes", blue [{ name: "xAxis", labelTopMargin: 10 }] ); -
labelVerticalAlignment
- Type:
- enumeration
- Default:
- top
the vertical alignment to use for the labels. Only applicable to horizontal axes.
Members
- top
- Type:string
- top aligns the labels.
- center
- Type:string
- center aligns the labels.
- bottom
- Type:string
- bottom aligns the labels.
Code Sample
// Initialization $(".selector").igDataChart({ axes: [{ name: "xAxis", type: "numericX", labelVerticalAlignment: "center" }] }); // Get var axes = $(".selector").igDataChart("option", "axes"); axes[0].labelVerticalAlignment; // Set $(".selector").igDataChart("option", "axes", blue [{ name: "xAxis", labelVerticalAlignment: "center" }] ); -
labelVisibility
- Type:
- enumeration
- Default:
- visible
Specifies whether the labels are visible.
Members
- visible
- Type:string
- The labels should be visisble for this axis.
- collapsed
- Type:string
- The labels should not be visible for this axis.
Code Sample
// Initialization $(".selector").igDataChart({ axes: [{ name: "xAxis", type: "numericX", labelVisibility: "collapsed" }] }); // Get var axes = $(".selector").igDataChart("option", "axes"); axes[0].labelVisibility; // Set $(".selector").igDataChart("option", "axes", [{ name: "xAxis", type: "numericX", labelVisibility: "collapsed" }] ); -
logarithmBase
- Type:
- number
- Default:
- 10
Gets or sets the LogarithmBase property.
Code Sample
// Initialization $(".selector").igDataChart({ axes: [{ name: "xAxis", type: "numericX", logarithmBase: 2 }] }); // Get var axes = $(".selector").igDataChart("option", "axes"); axes[0].logarithmBase; // Set $(".selector").igDataChart("option", "axes", [{ name: "xAxis", type: "numericX", logarithmBase: 2 }] ); -
majorStroke
- Type:
- string
- Default:
- null
Gets or sets the MajorStroke property.
Code Sample
// Initialization $(".selector").igDataChart({ axes: [{ name: "xAxis", type: "numericX", majorStroke: "blue" }] }); // Get var axes = $(".selector").igDataChart("option", "axes"); axes[0].majorStroke; // Set $(".selector").igDataChart("option", "axes", blue [{ name: "xAxis", type: "numericX", majorStroke: "blue" }] ); -
majorStrokeThickness
- Type:
- number
- Default:
- 1
Gets or sets the MajorStrokeThickness property.
Code Sample
// Initialization $(".selector").igDataChart({ axes: [{ name: "xAxis", type: "numericX", majorStrokeThickness: 5 }] }); // Get var axes = $(".selector").igDataChart("option", "axes"); axes[0].majorStrokeThickness; // Set $(".selector").igDataChart("option", "axes", blue [{ name: "xAxis", type: "numericX", majorStrokeThickness: 5 }] ); -
maximumValue
- Type:
- number
- Default:
- 0
Gets or sets the axis MaximumValue.
Code Sample
// Initialization $(".selector").igDataChart({ axes: [{ name: "xAxis", type: "numericX", maximumValue: 1500 }] }); // Get var axes = $(".selector").igDataChart("option", "axes"); axes[0].maximumValue; // Set $(".selector").igDataChart("option", "axes", blue [{ name: "xAxis", type: "numericX", maximumValue: 1500 }] ); -
minimumValue
- Type:
- number
- Default:
- 0
Gets or sets the axis MinimumValue.
Code Sample
// Initialization $(".selector").igDataChart({ axes: [{ name: "xAxis", type: "numericX", minimumValue: 500 }] }); // Get var axes = $(".selector").igDataChart("option", "axes"); axes[0].minimumValue; // Set $(".selector").igDataChart("option", "axes", blue [{ name: "xAxis", type: "numericX", minimumValue: 500 }] ); -
minorStroke
- Type:
- string
- Default:
- null
Gets or sets the MinorStroke property.
Code Sample
// Initialization $(".selector").igDataChart({ axes: [{ name: "xAxis", type: "numericX", minorStroke: "grey" }] }); // Get var axes = $(".selector").igDataChart("option", "axes"); axes[0].minorStroke; // Set $(".selector").igDataChart("option", "axes", blue [{ name: "xAxis", type: "numericX", minorStroke: "grey" }] ); -
minorStrokeThickness
- Type:
- number
- Default:
- 1
Gets or sets the MinorStrokeThickness property.
Code Sample
// Initialization $(".selector").igDataChart({ axes: [{ name: "xAxis", type: "numericX", minorStrokeThickness: 2 }] }); // Get var axes = $(".selector").igDataChart("option", "axes"); axes[0].minorStrokeThickness; // Set $(".selector").igDataChart("option", "axes", blue [{ name: "xAxis", type: "numericX", minorStrokeThickness: 2 }] ); -
name
- Type:
- string
- Default:
- null
The unique identifier of the axis.
Code Sample
// Initialization $(".selector").igDataChart({ axes: [{ name: "xAxis", type: "numericX" }] }); // Get var axes = $(".selector").igDataChart("option", "axes"); axes[0].name; // Set $(".selector").igDataChart("option", "axes", blue [{ name: "xAxis", type: "numericX" }] ); -
overlap
- Type:
- number
- Default:
- 0
Gets or sets the amount of overlap between adjacent categories for the current axis object.
The overlap is silently clamped to the range [-1, 1] when used.Code Sample
// Initialization $(".selector").igDataChart({ axes: [{ name: "xAxis", type: "numericX", overlap: 0.5 }] }); // Get var axes = $(".selector").igDataChart("option", "axes"); axes[0].overlap; // Set $(".selector").igDataChart("option", "axes", blue [{ name: "xAxis", type: "numericX", overlap: 0.5 }] ); -
radiusExtentScale
- Type:
- number
- Default:
- 0.75
Defines the percentage of the maximum radius extent to use as the maximum radius. Should be
a value between 0.0 and 1.0.Code Sample
// Initialization $(".selector").igDataChart({ axes: [{ name: "xAxis", type: "numericX", radiusExtentScale: 0.5 }] }); // Get var axes = $(".selector").igDataChart("option", "axes"); axes[0].radiusExtentScale; // Set $(".selector").igDataChart("option", "axes", blue [{ name: "xAxis", type: "numericX", radiusExtentScale: 0.5 }] ); -
referenceValue
- Type:
- number
- Default:
- 0
Gets or sets the ReferenceValue property.
Code Sample
// Initialization $(".selector").igDataChart({ axes: [{ name: "xAxis", type: "numericX", referenceValue: 0.5 }] }); // Get var axes = $(".selector").igDataChart("option", "axes"); axes[0].referenceValue; // Set $(".selector").igDataChart("option", "axes", blue [{ name: "xAxis", type: "numericX", referenceValue: 0.5 }] ); -
remove
- Type:
- bool
- Default:
- false
Set to true in order to have an existing axis removed from the chart, by name.
Code Sample
//Set $(".selector").igDataChart("option", "axes", [{ name: "xAxis", remove: true }] ); -
responseDataKey
- Type:
- string
- Default:
- null
See $.ig.DataSource. Specifies the name of the property in which data records are held if the response is wrapped.
Code Sample
var data = { "Records": [{ "Label": "2009", "Item1": "Value1", "Item2": 1000, "Item3": 1019.75}, { "Label": "2010", "Item1": "Value2", "Item2": 1500, "Item3": 1180.25}, { "Label": "2011", "Item1": "Value3", "Item2": 1200, "Item3": 1205.55}, { "Label": "2012", "Item1": "Value4", "Item2": 1450, "Item3": 1144.65}] }; // Initialization $(".selector").igDataChart({ axes: [{ name: "xAxis", type: "categoryX", dataSource: data, responseDataKey: "Records" }, { name: "yAxis", type: "numericY" }] }); // Get var axes = $(".selector").igDataChart("option", "axes"); axes[0].responseDataKey; // Set $(".selector").igDataChart("option", "axes", [{ name: "xAxis", type: "categoryX", dataSource: data, responseDataKey: "Records" }] ); -
showFirstLabel
- Type:
- bool
- Default:
- true
Sets whether or not to show the first label on the axis.
Code Sample
// Initialization $(".selector").igDataChart({ axes: [{ name: "xAxis", type: "numericX", showFirstLabel: false }] }); // Get var axes = $(".selector").igDataChart("option", "axes"); axes[0].showFirstLabel; // Set $(".selector").igDataChart("option", "axes", blue [{ name: "xAxis", showFirstLabel: false }] ); -
startAngleOffset
- Type:
- number
- Default:
- 0
Indicates the angle in degress that the chart's 0th angle should be offset.
Code Sample
// Initialization $(".selector").igDataChart({ axes: [{ name: "xAxis", type: "numericX", startAngleOffset: 30 }] }); // Get var axes = $(".selector").igDataChart("option", "axes"); axes[0].startAngleOffset; // Set $(".selector").igDataChart("option", "axes", blue [{ name: "xAxis", type: "numericX", startAngleOffset: 30 }] ); -
strip
- Type:
- string
- Default:
- null
Gets or sets the Strip property.
Code Sample
// Initialization $(".selector").igDataChart({ axes: [{ name: "xAxis", type: "numericX", strip: "grey" }] }); // Get var axes = $(".selector").igDataChart("option", "axes"); axes[0].strip; // Set $(".selector").igDataChart("option", "axes", blue [{ name: "xAxis", type: "numericX", strip: "grey" }] ); -
stroke
- Type:
- string
- Default:
- null
Gets or sets the Stroke property.
Code Sample
// Initialization $(".selector").igDataChart({ axes: [{ name: "xAxis", type: "numericX", stroke: "blue" }] }); // Get var axes = $(".selector").igDataChart("option", "axes"); axes[0].stroke; // Set $(".selector").igDataChart("option", "axes", blue [{ name: "xAxis", type: "numericX", stroke: "blue" }] ); -
strokeThickness
- Type:
- number
- Default:
- 1
Gets or sets the StrokeThickness property.
Code Sample
// Initialization $(".selector").igDataChart({ axes: [{ name: "xAxis", type: "numericX", strokeThickness: 5 }] }); // Get var axes = $(".selector").igDataChart("option", "axes"); axes[0].strokeThickness; // Set $(".selector").igDataChart("option", "axes", [{ name: "xAxis", type: "numericX", strokeThickness: 5 }] ); -
tickLength
- Type:
- number
- Default:
- 0
The length of the tickmarks to display for this axis.
Code Sample
// Initialization $(".selector").igDataChart({ axes: [{ name: "xAxis", type: "numericX", tickLength: 5 }] }); // Get var axes = $(".selector").igDataChart("option", "axes"); axes[0].tickLength; // Set $(".selector").igDataChart("option", "axes", [{ name: "xAxis", tickLength: 5 }] ); -
tickStroke
- Type:
- object
- Default:
- black
The color to use for the tickmarks.
Code Sample
// Initialization $(".selector").igDataChart({ axes: [{ name: "xAxis", type: "numericX", tickStroke: "blue" }] }); // Get var axes = $(".selector").igDataChart("option", "axes"); axes[0].tickStroke; // Set $(".selector").igDataChart("option", "axes", [{ name: "xAxis", tickStroke: "blue" }] ); -
tickStrokeThickness
- Type:
- number
- Default:
- 0.5
The stroke thickness to use for the tickmarks.
Code Sample
// Initialization $(".selector").igDataChart({ axes: [{ name: "xAxis", type: "numericX", tickStrokeThickness: 2 }] }); // Get var axes = $(".selector").igDataChart("option", "axes"); axes[0].tickStrokeThickness; // Set $(".selector").igDataChart("option", "axes", [{ name: "xAxis", type: "numericX", tickStrokeThickness: 2 }] ); -
title
- Type:
- string
- Default:
- null
The title to display for the component.
Code Sample
// Initialization $(".selector").igDataChart({ axes: [{ name: "xAxis", type: "numericX", title: "Years" }] }); // Get var axes = $(".selector").igDataChart("option", "axes"); axes[0].title; // Set $(".selector").igDataChart("option", "axes", [{ name: "xAxis", type: "numericX", title: "Years" }] ); -
titleAngle
- Type:
- number
- Default:
- 0
The angle to use for the axis title.
Code Sample
// Initialization $(".selector").igDataChart({ axes: [{ name: "xAxis", type: "numericX", title: "Years", titleAngle: 90 }] }); // Get var axes = $(".selector").igDataChart("option", "axes"); axes[0].titleAngle; // Set $(".selector").igDataChart("option", "axes", [{ name: "xAxis", type: "numericX", title: "Years", titleAngle: 90 }] ); -
titleBottomMargin
- Type:
- number
- Default:
- 0
The bottom margin to use for the title.
Code Sample
// Initialization $(".selector").igDataChart({ axes: [{ name: "xAxis", type: "numericX", title: "Years", titleBottomMargin:20 }] }); // Get var axes = $(".selector").igDataChart("option", "axes"); axes[0].titleBottomMargin; // Set $(".selector").igDataChart("option", "axes", [{ name: "xAxis", type: "numericX", title: "Years", titleBottomMargin: 20 }] ); -
titleHorizontalAlignment
- Type:
- enumeration
- Default:
- center
the horizontal alignment to use for the title.
Members
- left
- Type:string
- left aligns the title.
- center
- Type:string
- center aligns the title.
- right
- Type:string
- right aligns the title.
Code Sample
// Initialization $(".selector").igDataChart({ axes: [{ name: "xAxis", type: "numericX", title: "Years", titleHorizontalAlignment: "left" }] }); // Get var axes = $(".selector").igDataChart("option", "axes"); axes[0].titleHorizontalAlignment; // Set $(".selector").igDataChart("option", "axes", [{ name: "xAxis", type: "numericX", title: "Years", titleHorizontalAlignment: "left" }] ); -
titleLeftMargin
- Type:
- number
- Default:
- 0
The left margin to use for the title.
Code Sample
// Initialization $(".selector").igDataChart({ axes: [{ name: "xAxis", type: "numericX", title: "Years", titleLeftMargin: 20 }] }); // Get var axes = $(".selector").igDataChart("option", "axes"); axes[0].titleLeftMargin; // Set $(".selector").igDataChart("option", "axes", [{ name: "xAxis", type: "numericX", title: "Years", titleLeftMargin: 20 }] ); -
titleMargin
- Type:
- number
- Default:
- 0
The margin to display around the title of the axis.
Code Sample
// Initialization $(".selector").igDataChart({ axes: [{ name: "xAxis", type: "numericX", title: "Years", titleMargin: {top:20 , bottom:40, left:45, right:23} }] }); // Get var axes = $(".selector").igDataChart("option", "axes"); axes[0].titleMargin; // Set $(".selector").igDataChart("option", "axes", [{ name: "xAxis", type: "numericX", title: "Years", titleMargin: {top:20 , bottom:40, left:45, right:23} }] ); -
titlePosition
- Type:
- enumeration
- Default:
- auto
the position to use for the title.
Members
- auto
- Type:string
- the title is positioned automatically.
- left
- Type:string
- the title is positioned on the left of the labels, if applicable.
- right
- Type:string
- the title is positioned on the right of the labels, if applicable.
- top
- Type:string
- the title is positioned on the top of the labels, if applicable.
- bottom
- Type:string
- the title is positioned on the bottom of the labels, if applicable.
Code Sample
// Initialization $(".selector").igDataChart({ axes: [{ name: "xAxis", type: "numericX", title: "Years", titlePosition: "top" }] }); // Get var axes = $(".selector").igDataChart("option", "axes"); axes[0].titlePosition; // Set $(".selector").igDataChart("option", "axes", [{ name: "xAxis", type: "numericX", title: "Years", titlePosition: "top" }] ); -
titleRightMargin
- Type:
- number
- Default:
- 0
The right margin to use for the title.
Code Sample
// Initialization $(".selector").igDataChart({ axes: [{ name: "xAxis", type: "numericX", title: "Years", titleRightMargin: 20 }] }); // Get var axes = $(".selector").igDataChart("option", "axes"); axes[0].titleRightMargin; // Set $(".selector").igDataChart("option", "axes", [{ name: "xAxis", type: "numericX", title: "Years", titleRightMargin: 20 }] ); -
titleTextStyle
- Type:
- string
- Default:
- null
The css font property to use for the title.
Code Sample
// Initialization $(".selector").igDataChart({ axes: [{ name: "xAxis", type: "numericX", title: "Years", titleTextStyle: "26pt Times New Roman|Georgia|Serif" }] }); // Get var axes = $(".selector").igDataChart("option", "axes"); axes[0].titleTextStyle; // Set $(".selector").igDataChart("option", "axes", [{ name: "xAxis", type: "numericX", title: "Years", titleTextStyle: "26pt Times New Roman|Georgia|Serif" }] ); -
titleTopMargin
- Type:
- number
- Default:
- 0
The top margin to use for the title.
Code Sample
// Initialization $(".selector").igDataChart({ axes: [{ name: "xAxis", type: "numericX", title: "Years", titleTopMargin: 20 }] }); // Get var axes = $(".selector").igDataChart("option", "axes"); axes[0].titleTopMargin; // Set $(".selector").igDataChart("option", "axes", [{ name: "xAxis", type: "numericX", title: "Years", titleTopMargin: 20 }] ); -
titleVerticalAlignment
- Type:
- enumeration
- Default:
- center
the vertical alignment to use for the title.
Members
- center
- Type:string
- center aligns the title.
Code Sample
// Initialization $(".selector").igDataChart({ axes: [{ name: "xAxis", type: "numericX", title: "Years", titleVerticalAlignment: "center" }] }); // Get var axes = $(".selector").igDataChart("option", "axes"); axes[0].titleVerticalAlignment; // Set $(".selector").igDataChart("option", "axes", [{ name: "xAxis", type: "numericX", title: "Years", titleVerticalAlignment: "center" }] ); -
type
- Type:
- enumeration
- Default:
- null
Type of the axis.
Members
- numericX
- Type:string
- Specify the axis as numeric X axis. Useful for displaying scatter, category and financial price series.
- numericY
- Type:string
- Specify the axis as numeric Y axis.Useful for displaying scatter, category and financial price series.
- categoryX
- Type:string
- Specify the axis as category X axis. Useful for displaying scatter, category and financial price series.
- categoryDateTimeX
- Type:string
- Specify the axis as category datetime X axis. Useful for displaying category and financial price series with date based data.
- categoryY
- Type:string
- Specify the axis as category Y axis. Useful for displaying scatter, category and financial price series.
- categoryAngle
- Type:string
- Specify the axis as category angle axis. Useful for displaying polar and radial categories.
- numericAngle
- Type:string
- Specify the axis as numeric angle axis. Useful for displaying polar and radial series.
- numericRadius
- Type:string
- Specify the axis as numeric radius axis. Useful for displaying polar and radial series.
Code Sample
// Initialization $(".selector").igDataChart({ axes: [{ name: "xAxis", type: "numericX" }] }); // Get var axes = $(".selector").igDataChart("option", "axes"); axes[0].type; // Set $(".selector").igDataChart("option", "axes", blue [{ name: "xAxis", type: "numericX" }] ); -
useClusteringMode
- Type:
- bool
- Default:
- false
Gets or sets whether the cateogory axis should use clustering display mode even if no series are present that would force clustering mode.
-
useEnhancedIntervalManagement
- Type:
- bool
- Default:
- false
Gets or sets the whether to use more advanced heuristics when determining the initial number of labels to render, before resolving collisions, etc.
-
bottomMargin
- Type:
- number
- Default:
- 0
Sets or gets the bottom margin to use around the chart content in the canvas.
Code Sample
//Initialize $(".selector").igDataChart({ bottomMargin : 20 }); //Get var margin = $(".selector").igDataChart("option", "bottomMargin"); //Set $(".selector").igDataChart("option", "bottomMargin", 20); -
brushes
- Type:
- object
- Default:
- null
Gets or sets the Brushes property.
The brushes property defines the palette from which automatically assigned series brushes are selected.
The value provided should be an array of css color strings. Optionally the first element can be a string reading "RGB" or "HSV" to specify the interpolation mode of the collection.Code Sample
// Initialization $(".selector").igDataChart({ brushes: [ "#ff0000", "#ffff00", "#00ffff" ] }); // Get var brushes = $(".selector").igDataChart("option", "brushes"); // Set $(".selector").igDataChart("option", "brushes", [ "#ff0000", "#ffff00", "#00ffff" ]); -
circleMarkerTemplate
- Type:
- object
- Default:
- null
Gets or sets the template to use for circle markers on the chart.
Defines the marker template used for
series with a marker type of circle.
The provided object should have properties called render and optionally measure. See definition for option: legendItemBadgeTemplate.Code Sample
//Initialize $(".selector").igDataChart({ circleMarkerTemplate: { measure: function(measureInfo) { measureInfo.context; // either a DOM element or a CanvasContext2D depending on the particular template scenario measureInfo.width; // if value is present, specifies the available width, user may set to desired width for content measureInfo.height; // if value is present, specifies the available height, user may set to desired height for content measureInfo.isConstant; // user should set to true if desired with and height will always be the same for this template measureInfo.data; // if present, represents the contextual data for this template] }, render: function (renderInfo) { renderInfo.context; // either a DOM element or a CanvasContext2D depending on the particular template scenario renderInfo.xPosition; // if present, specifies the x position at which to render the content renderInfo.yPosition; // if present, specifies the y position at which to render the content renderInfo.availableWidth; // if present, specifies the available width in which to render the content renderInfo.availableHeight; // if present, specifies the available height in which to render the content renderInfo.data; // if present, specifies the data that is in context for this content renderInfo.isHitTestRender; // if true, indicates that this is a special render pass for hit testing, in which case the brushes from the data should be used } } }); -
contentHitTestMode
- Type:
- enumeration
- Default:
- auto
Gets or sets which type of hit testing the series should use.
Members
- auto
- Type:string
- automatically decide the appropriate hit test mode for the series.
- computational
- Type:string
- use a computational based approach to determine which series has been hit. This uses loose bounding boxes, in some cases, and can range in time complexity between O(1) and O(log n) to find a hit. This decreases frame render time compared to color encoded.
- colorEncoded
- Type:string
- use a color encoded off screen buffer for hit testing. This can have extremely rare false positives where the wrong series is hit (this is due to our inability to disable anti-aliasing in our color buffer), but should always be O(1) time for determining a hit series. This increases frame render time, however. Consider using this if hit testing time is degrading performance.
- mixed
- Type:string
- let each series decide which hit testing mode to use individually based on their own hit test mode.
- mixedFavoringComputational
- Type:string
- let each series decide which hit testing mode to use individually based on their own hit test mode, but evaluate all computational hits before evaluating any color encoding hits.
-
crosshairPoint
- Type:
- object
- Default:
- {}
Gets or sets the cross hair point (in world coordinates)
Either or both of the crosshair point's X and Y may be set to double.NaN, in which
case the relevant crosshair line is hidden.Code Sample
// Initialization $(".selector").igDataChart({ crosshairPoint: { x: 0.5, y: 0.5 } }); // Get var crosshairPoint = $(".selector").igDataChart("option", "crosshairPoint"); // Set $(".selector").igDataChart("option", "crosshairPoint", { x: 0.5, y: 0.5 });-
x
- Type:
- number
- Default:
- ""
The x coordinate.
Code Sample
// Initialization $(".selector").igDataChart({ crosshairPoint: { x: 0.5, y: 0.5 } }); // Get var crosshairPoint = $(".selector").igDataChart("option", "crosshairPoint"); var x = crosshairPoint.x; // Set $(".selector").igDataChart("option", "crosshairPoint", { x: 0.5, y: 0.5 }); -
y
- Type:
- number
- Default:
- ""
The y coordinate.
Code Sample
//  Initialization
$(".selector").igDataChart({
    crosshairPoint: { x: 0.5, y: 0.5 }
});

//  Get
var crosshairPoint = $(".selector").igDataChart("option", "crosshairPoint");
var y =  crosshairPoint.y;

//	Set
$(".selector").igDataChart("option", "crosshairPoint", { x: 0.5, y: 0.5 });
-
crosshairVisibility
- Type:
- enumeration
- Default:
- collapsed
Gets or sets the current Chart's crosshair visibility override.
Members
- visible
- Type:string
- Crosshair should be visible.
- collapsed
- Type:string
- Crosshair should not be visible.
Code Sample
// Initialization $(".selector").igDataChart({ crosshairVisibility: "collapsed" }); // Get var opValue = $(".selector").igDataChart("option", "crosshairVisibility"); // Set $(".selector").igDataChart("option", "crosshairVisibility", "collapsed"); -
dataSource
- Type:
- object
- Default:
- null
Can be any valid data source accepted by $.ig.DataSource, or an instance of an $.ig.DataSource itself.
Code Sample
// Initialization var data1 = [{"ID": 1, "Cost": 12.5}, {"ID": 2, "Cost": 18.56}, {"ID": 3, "Cost": 22.18}]; $(".selector").igDataChart({ dataSource: data1 }); // Get var dataSource = $(".selector").igDataChart("option", "dataSource"); // Set var data1 = [{"ID": 1, "Cost": 12.5}, {"ID": 2, "Cost": 18.56}, {"ID": 3, "Cost": 22.18}]; $(".selector").igDataChart("option", "dataSource", data1); -
dataSourceType
- Type:
- string
- Default:
- null
Explicitly set data source type (such as "json"). Please refer to the documentation of $.ig.DataSource and its type property.
Code Sample
// Initialization $(".selector").igDataChart({ dataSourceType: "array" }); // Get var opValue = $(".selector").igDataChart("option", "dataSourceType"); // Set $(".selector").igDataChart("option", "dataSourceType", "array"); -
dataSourceUrl
- Type:
- string
- Default:
- null
Specifies a remote URL accepted by $.ig.DataSource in order to request data from it.
Code Sample
// Initialization $(".selector").igDataChart({ dataSourceUrl: "http://www.example.com" }); // Get var opValue = $(".selector").igDataChart("option", "dataSourceUrl"); // Set $(".selector").igDataChart("option", "dataSourceUrl", "http://www.example.com"); -
defaultInteraction
- Type:
- enumeration
- Default:
- dragZoom
Gets or sets the DefaultInteraction property. The default interaction state defines the chart's response to mouse events.
Members
- none
- Type:string
- User gesture will not change the state of the chart.
- dragZoom
- Type:string
- User gesture will start a drag rectangle to zoom the chart.
- dragPan
- Type:string
- User gesture will start a pan action to move the chart's window.
Code Sample
// Initialization $(".selector").igDataChart({ defaultInteraction: "dragZoom" }); // Get var opValue = $(".selector").igDataChart("option", "defaultInteraction"); // Set $(".selector").igDataChart("option", "defaultInteraction", "dragZoom"); -
diamondMarkerTemplate
- Type:
- object
- Default:
- null
Gets or sets the template to use for diamond markers on the chart.
Defines the marker template used for
series with a marker type of diamond.
The provided object should have properties called render and optionally measure. See definition for option: legendItemBadgeTemplate.Code Sample
//Initialize $(".selector").igDataChart({ diamondMarkerTemplate: { measure: function(measureInfo) { measureInfo.context; // either a DOM element or a CanvasContext2D depending on the particular template scenario measureInfo.width; // if value is present, specifies the available width, user may set to desired width for content measureInfo.height; // if value is present, specifies the available height, user may set to desired height for content measureInfo.isConstant; // user should set to true if desired with and height will always be the same for this template measureInfo.data; // if present, represents the contextual data for this template] }, render: function (renderInfo) { renderInfo.context; // either a DOM element or a CanvasContext2D depending on the particular template scenario renderInfo.xPosition; // if present, specifies the x position at which to render the content renderInfo.yPosition; // if present, specifies the y position at which to render the content renderInfo.availableWidth; // if present, specifies the available width in which to render the content renderInfo.availableHeight; // if present, specifies the available height in which to render the content renderInfo.data; // if present, specifies the data that is in context for this content renderInfo.isHitTestRender; // if true, indicates that this is a special render pass for hit testing, in which case the brushes from the data should be used } } }); -
dragModifier
- Type:
- enumeration
- Default:
- none
Gets or sets the current Chart's DragModifier property.
Members
- none
- Type:string
- No modifier key is set.
- alt
- Type:string
- The modifier is set to alt key.
- control
- Type:string
- The modifier is set to control key.
- shift
- Type:string
- The modifier is set to shift key.
Code Sample
// Initialization $(".selector").igDataChart({ dragModifier: "control" }); // Get var opValue = $(".selector").igDataChart("option", "dragModifier"); // Set $(".selector").igDataChart("option", "dragModifier", "control"); -
gridMode
- Type:
- enumeration
- Default:
- behindSeries
Gets or sets the GridMode property.
Members
- none
- Type:string
- No chart grid.
- beforeSeries
- Type:string
- Chart grid should be rendered before or in front of the data series.
- behindSeries
- Type:string
- Chart grid should be rendered behind or in back of the data series.
Code Sample
// Initialization $(".selector").igDataChart({ gridMode: "beforeSeries" }); // Get var opValue = $(".selector").igDataChart("option", "gridMode"); // Set $(".selector").igDataChart("option", "gridMode", "beforeSeries"); -
height
- Type:
- enumeration
- Default:
- null
The height of the chart. It can be set as a number in pixels, string (px) or percentage (%).
Code Sample
// Initialization $(".selector").igDataChart({ height: 250 }); // Get var opValue = $(".selector").igDataChart("option", "height"); // Set $(".selector").igDataChart("option", "height", 250); -
hexagonMarkerTemplate
- Type:
- object
- Default:
- null
Gets or sets the template to use for hexagon markers on the chart.
Defines the marker template used for
series with a marker type of hexagon.
The provided object should have properties called render and optionally measure. See definition for option: legendItemBadgeTemplate.Code Sample
//Initialize $(".selector").igDataChart({ hexagonMarkerTemplate: { measure: function(measureInfo) { measureInfo.context; // either a DOM element or a CanvasContext2D depending on the particular template scenario measureInfo.width; // if value is present, specifies the available width, user may set to desired width for content measureInfo.height; // if value is present, specifies the available height, user may set to desired height for content measureInfo.isConstant; // user should set to true if desired with and height will always be the same for this template measureInfo.data; // if present, represents the contextual data for this template] }, render: function (renderInfo) { renderInfo.context; // either a DOM element or a CanvasContext2D depending on the particular template scenario renderInfo.xPosition; // if present, specifies the x position at which to render the content renderInfo.yPosition; // if present, specifies the y position at which to render the content renderInfo.availableWidth; // if present, specifies the available width in which to render the content renderInfo.availableHeight; // if present, specifies the available height in which to render the content renderInfo.data; // if present, specifies the data that is in context for this content renderInfo.isHitTestRender; // if true, indicates that this is a special render pass for hit testing, in which case the brushes from the data should be used } } }); -
hexagramMarkerTemplate
- Type:
- object
- Default:
- null
Gets or sets the template to use for hexagram markers on the chart.
Defines the marker template used for
series with a marker type of hexagram.
The provided object should have properties called render and optionally measure. See definition for option: legendItemBadgeTemplate.Code Sample
//Initialize $(".selector").igDataChart({ hexagramMarkerTemplate: { measure: function(measureInfo) { measureInfo.context; // either a DOM element or a CanvasContext2D depending on the particular template scenario measureInfo.width; // if value is present, specifies the available width, user may set to desired width for content measureInfo.height; // if value is present, specifies the available height, user may set to desired height for content measureInfo.isConstant; // user should set to true if desired with and height will always be the same for this template measureInfo.data; // if present, represents the contextual data for this template] }, render: function (renderInfo) { renderInfo.context; // either a DOM element or a CanvasContext2D depending on the particular template scenario renderInfo.xPosition; // if present, specifies the x position at which to render the content renderInfo.yPosition; // if present, specifies the y position at which to render the content renderInfo.availableWidth; // if present, specifies the available width in which to render the content renderInfo.availableHeight; // if present, specifies the available height in which to render the content renderInfo.data; // if present, specifies the data that is in context for this content renderInfo.isHitTestRender; // if true, indicates that this is a special render pass for hit testing, in which case the brushes from the data should be used } } }); -
highlightingTransitionDuration
- Type:
- number
- Default:
- 300
The length, in milliseconds of the highlighting transition.
Code Sample
//Initialization <script type="text/javascript"> $(function () { $("#chart").igDataChart({ width: "100%", height: "400px", legend: { element: "lineLegend" }, title: "Population per Country", subtitle: "A comparision of population in 1995 and 2005", dataSource: data, axes: [ { name: "NameAxis", type: "categoryX", label: "CountryName" }, { name: "PopulationAxis", type: "numericY" } ], series: [ { name: "2005Population", type: "line", title: "2005", xAxis: "NameAxis", yAxis: "PopulationAxis", valueMemberPath: "Pop2005", isHighlightingEnabled: true, highlightingTransitionDuration: 500 } ] }); }); </script> //Get var series = $(".selector").igDataChart("option", "series"); series[0].highlightingTransitionDuration; //Set $(".selector").igDataChart("option", "series", [{ name: "2005Population", type: "line", title: "2005", xAxis: "NameAxis", yAxis: "PopulationAxis", valueMemberPath: "Pop2005", highlightingTransitionDuration: 500 }] ); -
horizontalZoomable
- Type:
- bool
- Default:
- false
Gets or sets the current Chart's horizontal zoomability.
Code Sample
// Initialization $(".selector").igDataChart({ horizontalZoomable: true }); // Get var opValue = $(".selector").igDataChart("option", "horizontalZoomable"); // Set $(".selector").igDataChart("option", "horizontalZoomable", true); -
isSquare
- Type:
- bool
- Default:
- false
Gets or sets whether to use a square aspect ratio for the chart. This is locked to true for polar and radial charts.
Code Sample
// Initialization $(".selector").igDataChart({ isSquare: true }); // Get var opValue = $(".selector").igDataChart("option", "isSquare"); // Set $(".selector").igDataChart("option", "isSquare", true); -
isSurfaceInteractionDisabled
- Type:
- bool
- Default:
- false
Set to true in order to disable any interactions with the plot surface.
-
leftMargin
- Type:
- number
- Default:
- 0
Sets or gets the left margin to use around the chart content in the canvas.
Code Sample
//Initialize $(".selector").igDataChart({ leftMargin : 20 }); //Get var margin = $(".selector").igDataChart("option", "leftMargin"); //Set $(".selector").igDataChart("option", "leftMargin", 20); -
legend
- Type:
- object
- Default:
- {}
Can be any valid options accepted by $.ig.ChartLegend, or an instance of an $.ig.ChartLegend itself.
Code Sample
// Initialize $(".selector").igDataChart({ legend: { element: 'legend', type: 'legend' } }); // Get var legend = $(".selector").igDataChart("option", "legend"); // Set $(".selector").igDataChart("option", "legend", { element: 'legend', type: 'legend' });-
element
- Type:
- string
- Default:
- null
The name of the element to turn into a legend.
Code Sample
// Initialize $(".selector").igDataChart({ legend: { element: "legend", type: "legend" } }); // Get var legend = $(".selector").igDataChart("option", "legend"); legend.element; -
height
- Type:
- enumeration
- Default:
- null
The height of the legend. null will stretch vertically to fit data, no other height are defined.
Members
- null
- Type:object
- string
- The widget height can be set in pixels (px) and percentage (%).
- number
- The widget height can be set as a number.
Code Sample
// Initialize $(".selector").igDataChart({ legend: { element: "legend", type: "legend", height: "100px" } }); // Get var legend = $(".selector").igDataChart("option", "legend"); legend.height; -
type
- Type:
- enumeration
- Default:
- legend
Type of the legend.
Members
- item
- Type:string
- Specify the legend as item legend. It displays a legend item for each pie in the igPieChart control.
- legend
- Type:string
- Specify the legend as legend. It is supported by all types of series in the igDataChart control.
Code Sample
// Initialize $(".selector").igDataChart({ legend: { element: "legend", type: "legend" } }); // Get var legend = $(".selector").igDataChart("option", "legend"); legend.type; -
width
- Type:
- enumeration
- Default:
- null
The width of the legend.
Members
- null
- Type:object
- will stretch to fit data, if no other widths are defined.
- string
- The widget width can be set in pixels (px) and percentage (%).
- number
- The widget width can be set as a number.
Code Sample
// Initialize
$(".selector").igDataChart({
	  legend: {
        element: "legend",
        type: "legend",
        width: "100px"
    }
});

//Get
var legend = $(".selector").igDataChart("option", "legend");
legend.width;
-
markerBrushes
- Type:
- object
- Default:
- null
Gets or sets the MarkerBrushes property.
The marker brushes property defines the palette from which automatically assigned marker brushes are selected.
The value provided should be an array of css color strings. Optionally the first element can be a string reading "RGB" or "HSV" to specify the interpolation mode of the collection.Code Sample
// Initialization $(".selector").igDataChart({ markerBrushes: [ "#ff0000", "#ffff00", "#00ffff" ] }); // Get var opValue = $(".selector").igDataChart("option", "markerBrushes"); // Set $(".selector").igDataChart("option", "markerBrushes", [ "#ff0000", "#ffff00", "#00ffff" ]); -
markerOutlines
- Type:
- object
- Default:
- null
Gets or sets the MarkerOutlines property.
The marker outlines property defines the palette from which automatically assigned marker outlines are selected.
The value provided should be an array of css color strings. Optionally the first element can be a string reading "RGB" or "HSV" to specify the interpolation mode of the collection.Code Sample
// Initialization $(".selector").igDataChart({ markerOutlines: [ "#ff0000", "#ffff00", "#00ffff" ] }); // Get var markerOutlines = $(".selector").igDataChart("option", "markerOutlines"); // Set $(".selector").igDataChart("option", "markerOutlines", [ "#ff0000", "#ffff00", "#00ffff" ]); -
outlines
- Type:
- object
- Default:
- null
Gets or sets the Outlines property.
The outlines property defines the palette from which automatically assigned series outlines are selected.
The value provided should be an array of css color strings. Optionally the first element can be a string reading "RGB" or "HSV" to specify the interpolation mode of the collection.Code Sample
// Initialization $(".selector").igDataChart({ outlines: [ "#ff0000", "#ffff00", "#00ffff" ] }); // Get var opValue = $(".selector").igDataChart("option", "outlines"); // Set $(".selector").igDataChart("option", "outlines", [ "#ff0000", "#ffff00", "#00ffff" ]); -
overviewPlusDetailPaneVisibility
- Type:
- enumeration
- Default:
- collapsed
The visibility of the OverviewPlusDetailPane.
Members
- visible
- Type:string
- The overview pane should be visible.
- collapsed
- Type:string
- The overview pane should not be visible.
Code Sample
// Initialization $(".selector").igDataChart({ overviewPlusDetailPaneVisibility: "visible" }); // Get var opValue = $(".selector").igDataChart("option", "overviewPlusDetailPaneVisibility"); // Set $(".selector").igDataChart("option", "overviewPlusDetailPaneVisibility", "visible"); -
panModifier
- Type:
- enumeration
- Default:
- shift
Gets or sets the current Chart's PanModifier property.
Members
- none
- Type:string
- No modifier key is set.
- alt
- Type:string
- The modifier is set to alt key.
- control
- Type:string
- The modifier is set to control key.
- shift
- Type:string
- The modifier is set to shift key.
Code Sample
// Initialization $(".selector").igDataChart({ panModifier: "control" }); // Get var opValue = $(".selector").igDataChart("option", "panModifier"); // Set $(".selector").igDataChart("option", "panModifier", "control"); -
pentagonMarkerTemplate
- Type:
- object
- Default:
- null
Gets or sets the template to use for pentagon markers on the chart.
Defines the marker template used for
series with a marker type of pentagon.
The provided object should have properties called render and optionally measure. See definition for option: legendItemBadgeTemplate.Code Sample
//Initialize $(".selector").igDataChart({ pentagonMarkerTemplate: { measure: function(measureInfo) { measureInfo.context; // either a DOM element or a CanvasContext2D depending on the particular template scenario measureInfo.width; // if value is present, specifies the available width, user may set to desired width for content measureInfo.height; // if value is present, specifies the available height, user may set to desired height for content measureInfo.isConstant; // user should set to true if desired with and height will always be the same for this template measureInfo.data; // if present, represents the contextual data for this template] }, render: function (renderInfo) { renderInfo.context; // either a DOM element or a CanvasContext2D depending on the particular template scenario renderInfo.xPosition; // if present, specifies the x position at which to render the content renderInfo.yPosition; // if present, specifies the y position at which to render the content renderInfo.availableWidth; // if present, specifies the available width in which to render the content renderInfo.availableHeight; // if present, specifies the available height in which to render the content renderInfo.data; // if present, specifies the data that is in context for this content renderInfo.isHitTestRender; // if true, indicates that this is a special render pass for hit testing, in which case the brushes from the data should be used } } }); -
pentagramMarkerTemplate
- Type:
- object
- Default:
- null
Gets or sets the template to use for pentragram markers on the chart.
Defines the marker template used for
series with a marker type of pentagram.
The provided object should have properties called render and optionally measure. See definition for option: legendItemBadgeTemplate.Code Sample
//Initialize $(".selector").igDataChart({ pentagramMarkerTemplate: { measure: function(measureInfo) { measureInfo.context; // either a DOM element or a CanvasContext2D depending on the particular template scenario measureInfo.width; // if value is present, specifies the available width, user may set to desired width for content measureInfo.height; // if value is present, specifies the available height, user may set to desired height for content measureInfo.isConstant; // user should set to true if desired with and height will always be the same for this template measureInfo.data; // if present, represents the contextual data for this template] }, render: function (renderInfo) { renderInfo.context; // either a DOM element or a CanvasContext2D depending on the particular template scenario renderInfo.xPosition; // if present, specifies the x position at which to render the content renderInfo.yPosition; // if present, specifies the y position at which to render the content renderInfo.availableWidth; // if present, specifies the available width in which to render the content renderInfo.availableHeight; // if present, specifies the available height in which to render the content renderInfo.data; // if present, specifies the data that is in context for this content renderInfo.isHitTestRender; // if true, indicates that this is a special render pass for hit testing, in which case the brushes from the data should be used } } }); -
plotAreaBackground
- Type:
- string
- Default:
- null
Gets or sets the brush used as the background for the current Chart object's plot area.
Code Sample
//Initialize $(".selector").igDataChart({ plotAreaBackground: "grey" }); //Get var plotAreaBackground = $(".selector").igDataChart("option", "plotAreaBackground"); //Set var plotAreaBackground = $(".selector").igDataChart("option", "plotAreaBackground", "grey"); -
preferHigherResolutionTiles
- Type:
- bool
- Default:
- false
Sets whether the series viewer should prefer selecting higher resolution tiles over lower resolution tiles when performing tile zooming. Setting this to true will lower performance but increase quality.
-
previewRect
- Type:
- object
- Default:
- null
Gets or sets the preview rectangle.
The preview rectangle may be set to Rect.Empty, in which case the visible preview
strokePath is hidden.
The provided object should have numeric properties called left, top, width and height.Code Sample
// Initialization $(".selector").igDataChart({ previewRect: { left: 0.3, top: 0.3, width: 0.5, height: 0.5 } }); // Get var previewRect = $(".selector").igDataChart("option", "previewRect"); // Set $(".selector").igDataChart("option", "previewRect", { left: 0.3, top: 0.3, width: 0.5, height: 0.5 }); -
pyramidMarkerTemplate
- Type:
- object
- Default:
- null
Gets or sets the template to use for pyramid markers on the chart.
Defines the marker template used for
series with a marker type of pyramid.
The provided object should have properties called render and optionally measure. See definition for option: legendItemBadgeTemplate.Code Sample
//Initialize $(".selector").igDataChart({ pyramidMarkerTemplate: { measure: function(measureInfo) { measureInfo.context; // either a DOM element or a CanvasContext2D depending on the particular template scenario measureInfo.width; // if value is present, specifies the available width, user may set to desired width for content measureInfo.height; // if value is present, specifies the available height, user may set to desired height for content measureInfo.isConstant; // user should set to true if desired with and height will always be the same for this template measureInfo.data; // if present, represents the contextual data for this template] }, render: function (renderInfo) { renderInfo.context; // either a DOM element or a CanvasContext2D depending on the particular template scenario renderInfo.xPosition; // if present, specifies the x position at which to render the content renderInfo.yPosition; // if present, specifies the y position at which to render the content renderInfo.availableWidth; // if present, specifies the available width in which to render the content renderInfo.availableHeight; // if present, specifies the available height in which to render the content renderInfo.data; // if present, specifies the data that is in context for this content renderInfo.isHitTestRender; // if true, indicates that this is a special render pass for hit testing, in which case the brushes from the data should be used } } }); -
responseDataKey
- Type:
- string
- Default:
- null
See $.ig.DataSource. Specifies the name of the property in which data records are held if the response is wrapped.
Code Sample
// Initialize $(".selector").igDataChart({ responseDataKey: "Records" }); // Get var responseDataKey = $(".selector").igDataChart("option", "responseDataKey"); // Set var responseDataKey = $(".selector").igDataChart("option", "responseDataKey", "Records"); -
rightMargin
- Type:
- number
- Default:
- 0
Sets or gets the right margin to use around the chart content in the canvas.
Code Sample
//Initialize $(".selector").igDataChart({ rightMargin : 20 }); //Get var margin = $(".selector").igDataChart("option", "rightMargin"); //Set $(".selector").igDataChart("option", "rightMargin", 20); -
series
- Type:
- array
- Default:
- []
- Elements Type:
- object
An array of series objects.
Code Sample
// Initialization var data = [{ "Label": "1/1/2012", "Item1": 980, "Item2": 1000 }, { "Label": "1/2/2012", "Item1": 1200, "Item2": 1500 }]; $(".selector").igDataChart({ axes: [{ name: "xAxis", type: "categoryX", dataSource: data, label: "Label" }, { name: "yAxis", type: "numericY" }], series: [{ name: "series1", dataSource: data, title: "Price Series 1", type: "column", xAxis: "xAxis", yAxis: "yAxis", valueMemberPath: "Item1" }] }); // Get var series = $(".selector").igDataChart("option", "series"); series[0]; // Set $(".selector").igDataChart("series", [{ name: "series2", dataSource: data, title: "Price Series 2", type: "column", xAxis: "xAxis", yAxis: "yAxis", valueMemberPath: "Item1" }] );-
angleAxis
- Type:
- string
- Default:
- null
Gets the effective angle axis for the current series object.
Code Sample
// Initialization $(".selector").igDataChart({ axes: [{ name: "angleAxis", type: "categoryAngle", label: "Label" }, { name: "radiusAxis", type: "numericRadius" }], series: [{ name: "series1", dataSource: data, title: "Budget", type: "radialLine", angleAxis: "angleAxis", valueAxis: "radiusAxis", valueMemberPath: "Budget", }] }); // Get var series = $(".selector").igDataChart("option", "series"); series[0].angleAxis; // Set var series = $(".selector").igDataChart("option", [{ name: "series1", dataSource: data, title: "Budget", type: "radialLine", angleAxis: "angleAxis", valueAxis: "radiusAxis", valueMemberPath: "Budget", }] ); -
angleMemberPath
- Type:
- number
- Default:
- null
Gets or sets the x-radius of the ellipse that is used to round the corners of the column.
Code Sample
//Initialization $(".selector").igDataChart({ axes: [{ name: "angleAxis", type: "numericAngle" }, { name: "radiusAxis", type: "numericRadius" }], series: [{ name: "series1", title: "Sales", type: "polarScatter", angleAxis: "angleAxis", radiusAxis: "radiusAxis", angleMemberPath: "Index", radiusMemberPath: "Value1" }] }); //Get var series = $(".selector").igDataChart("option", "series"); series[0].angleMemberPath; //Set $(".selector").igDataChart("option", "series", [{ name: "series1", title: "Sales", type: "polarScatter", angleAxis: "angleAxis", radiusAxis: "radiusAxis", angleMemberPath: "Index", radiusMemberPath: "Value1" }] ); -
areaFillOpacity
- Type:
- number
- Default:
- 1.0
Gets or sets the opacity modifier to apply to the area fill shape of the series, if applicable.
Code Sample
// Initialization $(".selector").igDataChart({ axes: [{ name: "xAxis", type: "categoryX", label: "Label" }, { name: "yAxis", type: "numericY" }], series: [{ name: "series1", title: "Sales", type: "area", xAxis: "xAxis", yAxis: "yAxis", valueMemberPath: "Value1", areaFillOpacity: 0.8 }] }); // Get var series = $(".selector").igDataChart("option", "series"); series[0].areaFillOpacity; // Set $(".selector").igDataChart("series", [{ name: "series1", areaFillOpacity: 0.8 }] ); -
bandHighlightWidth
- Type:
- number
- Default:
- 10.0
Gets or sets the width to use for the highlight region if highlighting items in a grid aligned series (line, spline, etc), with a banded shape.
-
brush
- Type:
- string
- Default:
- null
Gets or sets the brush to use for the series.
Code Sample
//Initialization $(".selector").igDataChart({ axes: [{ name: "xAxis", type: "categoryX", label: "Label" }, { name: "yAxis", type: "numericY" }], series: [{ name: "series1", title: "Sales", type: "column", xAxis: "xAxis", yAxis: "yAxis", valueMemberPath: "Value1", brush: "blue" }] }); //Get var series = $(".selector").igDataChart("option", "series"); series[0].brush; //Set $(".selector").igDataChart("option", "series", [{ name: "series1", title: "Sales", type: "column", xAxis: "xAxis", yAxis: "yAxis", valueMemberPath: "Value1", brush: "blue" }] ); -
clipSeriesToBounds
- Type:
- bool
- Default:
- null
Gets or sets whether to clip the series to the bounds.
Setting this to true can effect performance.Code Sample
//Initialization $(".selector").igDataChart({ axes: [{ name: "xAxis", type: "numericX" }, { name: "yAxis", type: "numericY" }], series: [{ name: "series1", type: "scatter", xAxis: "xAxis", yAxis: "yAxis", xMemberPath: "Index", yMemberPath: "Value1", clipSeriesToBounds: true }] }); //Get var series = $(".selector").igDataChart("option", "series"); series[0].clipSeriesToBounds; //Set $(".selector").igDataChart("option", "series", [{ name: "series1", type: "scatter", xAxis: "xAxis", yAxis: "yAxis", xMemberPath: "Index", yMemberPath: "Value1", clipSeriesToBounds: true }] ); -
closeMemberPath
- Type:
- string
- Default:
- null
Gets or sets the close mapping property for the current series object.
Code Sample
//Initialization $(".selector").igDataChart({ axes: [{ name: "xAxis", type: "categoryX", dataSource: data, label: "Label" }, { name: "yAxis", type: "numericY" }], series: [{ name: "series1", dataSource: data, title: "Price", type: "financial", xAxis: "xAxis", yAxis: "yAxis", openMemberPath: "Open", highMemberPath: "High", lowMemberPath: "Low", closeMemberPath: "Close" }] }); //Get var series = $(".selector").igDataChart("option", "series"); series[0].closeMemberPath; //Set $(".selector").igDataChart("option", "series", [{ name: "series1", dataSource: data, title: "Price", type: "financial", xAxis: "xAxis", yAxis: "yAxis", openMemberPath: "Open", highMemberPath: "High", lowMemberPath: "Low", closeMemberPath: "Close" }] ); -
coercionMethods
- Type:
- object
- Default:
- null
Gets or gets the coercion methods to use when loading data from data sources.
Should be specified before setting any member paths, if being used. Setting it later
will not cause data to be reimported into the chart.Code Sample
// Initialization $(".selector").igDataChart({ axes: [{ name: "xAxis", type: "categoryDateTimeX", dataSource: data, label: "Date" }, { name: "yAxis", type: "numericY" }], series: [{ name: "series1", title: "Sales", type: "line", xAxis: "xAxis", yAxis: "yAxis", valueMemberPath: "Value!roundTo50", coercionMethods: { roundTo100: function (val) { var newVal = Math.round(val / 100) <dependency>100; return newVal; } } }] }); -
cursorPosition
- Type:
- object
- Default:
- null
Sets the position a cursor position to use instead of the current mouse cursor position for displaying the annotations in this layer.
Should be an object with an x and a y property in world coordinates (ranging from 0 to 1).Code Sample
//Initialization <script type="text/javascript"> $(function () { $("#chart").igDataChart({ dataSource: data, axes: [{ type: "categoryX", name: "NameAxis", label: "CountryName", }, { type: "numericY", name: "PopulationAxis", }], series: [ { name: "crosshairLayer", title: "crosshair", type: "crosshairLayer", cursorPosition: {x:0.5 , y:0.5} } ] }); }); </script> //Get var series = $(".selector").igDataChart("option", "series"); series[0].cursorPosition; //Set $(".selector").igDataChart("option", "series", [{ name: "crosshairLayer", title: "crosshair", type: "crosshairLayer", cursorPosition: {x:0.5 , y:0.5} }] ); -
dataSource
- Type:
- object
- Default:
- null
Can be any valid data source accepted by $.ig.DataSource, or an instance of an $.ig.DataSource itself.
Code Sample
//Initialization $(".selector").igDataChart({ axes: [{ name: "xAxis", type: "categoryX", dataSource: data, label: "Label" }, { name: "yAxis", type: "numericY" }], series: [{ name: "series1", dataSource: data, title: "Price", type: "financial", xAxis: "xAxis", yAxis: "yAxis", openMemberPath: "Open", highMemberPath: "High", lowMemberPath: "Low", closeMemberPath: "Close" }] }); //Get var series = $(".selector").igDataChart("option", "series"); series[0].dataSource; //Set $(".selector").igDataChart("option", "series", [{ name: "series1", dataSource: data, title: "Price", type: "financial", xAxis: "xAxis", yAxis: "yAxis", openMemberPath: "Open", highMemberPath: "High", lowMemberPath: "Low", closeMemberPath: "Close" }] ); -
dataSourceType
- Type:
- string
- Default:
- null
Explicitly set data source type (such as "json"). Please refer to the documentation of $.ig.DataSource and its type property.
Code Sample
// Initialization $(".selector").igDataChart({ axes: [{ name: "xAxis", type: "categoryX", dataSource: data, label: "Label" }, { name: "yAxis", type: "numericY" }], series: [{ name: "series1", dataSource: data, dataSourceType: "json", title: "Price", type: "column", xAxis: "xAxis", yAxis: "yAxis", valueMemberPath: "Item1" }] }); // Get var series = $(".selector").igDataChart("option", "series"); series[0].dataSourceType; // Set $(".selector").igDataChart("option", "series", [{ name: "series1", dataSource: data, dataSourceType: "json", title: "Price", type: "column", xAxis: "xAxis", yAxis: "yAxis", valueMemberPath: "Item1" }] ); -
dataSourceUrl
- Type:
- string
- Default:
- null
Specifies a remote URL accepted by $.ig.DataSource in order to request data from it.
Code Sample
//Initialization $(".selector").igDataChart({ axes: [{ name: "xAxis", type: "categoryX", dataSource: data, label: "Label" }, { name: "yAxis", type: "numericY" }], series: [{ name: "series1", dataSourceUrl: "http://www.example.com/price-data", dataSourceType: "json", title: "Price", type: "financial", xAxis: "xAxis", yAxis: "yAxis", openMemberPath: "Open", highMemberPath: "High", lowMemberPath: "Low", closeMemberPath: "Close" }] }); //Get var series = $(".selector").igDataChart("option", "series"); series[0].dataSource; //Set $(".selector").igDataChart("option", "series", [{ name: "series1", dataSourceUrl: "http://www.example.com/price-data", dataSourceType: "json", title: "Price", type: "financial", xAxis: "xAxis", yAxis: "yAxis", openMemberPath: "Open", highMemberPath: "High", lowMemberPath: "Low", closeMemberPath: "Close" }] ); -
discreteLegendItemTemplate
- Type:
- object
- Default:
- null
Gets or sets the DiscreteLegendItemTemplate property.
The legend item control content is created according to the DiscreteLegendItemTemplate on-demand by
the series object itself.
The provided object should have properties called render and optionally measure. See definition for option: legendItemBadgeTemplate.Code Sample
//Initialization $(".selector").igDataChart({ axes: [{ name: "xAxis", type: "numericX" }, { name: "yAxis", type: "numericY" }], series: [{ name: "series1", type: "scatter", xAxis: "xAxis", yAxis: "yAxis", xMemberPath: "Index", yMemberPath: "Value1", discreteLegendItemTemplate: { measure: function(measureInfo) { measureInfo.context; // either a DOM element or a CanvasContext2D depending on the particular template scenario measureInfo.width; // if value is present, specifies the available width, user may set to desired width for content measureInfo.height; // if value is present, specifies the available height, user may set to desired height for content measureInfo.isConstant; // user should set to true if desired with and height will always be the same for this template measureInfo.data; // if present, represents the contextual data for this template] }, render: function (renderInfo) { renderInfo.context; // either a DOM element or a CanvasContext2D depending on the particular template scenario renderInfo.xPosition; // if present, specifies the x position at which to render the content renderInfo.yPosition; // if present, specifies the y position at which to render the content renderInfo.availableWidth; // if present, specifies the available width in which to render the content renderInfo.availableHeight; // if present, specifies the available height in which to render the content renderInfo.data; // if present, specifies the data that is in context for this content renderInfo.isHitTestRender; // if true, indicates that this is a special render pass for hit testing, in which case the brushes from the data should be used } } }] }); -
displayType
- Type:
- enumeration
- Default:
- candlestick
Gets or sets the display for the current FinancialIndicator object.
Members
- candlestick
- Type:string
- Displays prices as a Japanese Candlestick.
- OHLC
- Type:string
- Displays prices as an OHLC bar.
Code Sample
// Initialization $(".selector").igDataChart({ axes: [{ name: "xAxis", type: "categoryX", dataSource: data, label: "Label" }, { name: "yAxis", type: "numericY" }], series: [{ name: "series1", dataSource: data, title: "Price", xAxis: "xAxis", yAxis: "yAxis", openMemberPath: "Open", highMemberPath: "High", lowMemberPath: "Low", closeMemberPath: "Close", type: "averageTrueRangeIndicator", displayType: "area" }] }); // Get var series = $(".selector").igDataChart("option", "series"); series[0].displayType; // Set $(".selector").igDataChart("option", "series", [{ name: "series1", dataSource: data, title: "Price", xAxis: "xAxis", yAxis: "yAxis", openMemberPath: "Open", highMemberPath: "High", lowMemberPath: "Low", closeMemberPath: "Close", type: "averageTrueRangeIndicator", displayType: "area" }] ); -
expectFunctions
- Type:
- bool
- Default:
- false
Gets or sets whether the series should expect that its data source members need to be called as functions to get their values.
-
fillMemberPath
- Type:
- string
- Default:
- null
Gets or sets the fill mapping property for the current series object.
Code Sample
//Initialization $(".selector").igDataChart({ axes: [{ name: "xAxis", type: "numericX" }, { name: "yAxis", type: "numericY" }], series: [{ name: "series1", type: "bubble", xAxis: "xAxis", yAxis: "yAxis", xMemberPath: "Index", yMemberPath: "Value1", radiusMemberPath: "Value2", fillMemberPath: "Value3", labelMemberPath: "Value2" }] }); //Get var series = $(".selector").igDataChart("option", "series"); series[0].fillMemberPath; //Set $(".selector").igDataChart("option", "series", [{ name: "series1", type: "bubble", xAxis: "xAxis", yAxis: "yAxis", xMemberPath: "Index", yMemberPath: "Value1", radiusMemberPath: "Value2", fillMemberPath: "Value3", labelMemberPath: "Value2" }] ); -
fillScale
- Type:
- object
- Default:
- null
Gets or sets the brush scale for the marker brush.
Code Sample
//Initialization $(".selector").igDataChart({ axes: [{ name: "xAxis", type: "numericX" }, { name: "yAxis", type: "numericY" }], series: [{ name: "series1", type: "bubble", xAxis: "xAxis", yAxis: "yAxis", xMemberPath: "Index", yMemberPath: "Value1", radiusMemberPath: "Value2", fillMemberPath: "Value3", labelMemberPath: "Value2", fillScale: { type: "value", brushes: ["red", "blue"], minimumValue: 0, maximumValue: 20 } }] }); //Get var series = $(".selector").igDataChart("option", "series"); series[0].fillScale; //Set $(".selector").igDataChart("option", "series", [{ name: "series1", type: "bubble", xAxis: "xAxis", yAxis: "yAxis", xMemberPath: "Index", yMemberPath: "Value1", radiusMemberPath: "Value2", fillMemberPath: "Value3", labelMemberPath: "Value2", fillScale: { type: "value", brushes: ["red", "blue"], minimumValue: 0, maximumValue: 20 } }] ); -
heatMaximum
- Type:
- number
- Default:
- 50
Gets or sets the value that maps to the maximum heat color.
Code Sample
//Initialization $(".selector").igDataChart({ series: [{ name: "series1", type: "highDensityScatter", xAxis: "xAxis", yAxis: "yAxis", xMemberPath: "Index", yMemberPath: "Value1", heatMaximum: 100 }] }); //Get var series = $(".selector").igDataChart("option", "series"); series[0].heatMaximum; //Set $(".selector").igDataChart("option", "series", [{ name: "series1", type: "highDensityScatter", xAxis: "xAxis", yAxis: "yAxis", xMemberPath: "Index", yMemberPath: "Value1" heatMaximum: 100 }]); -
heatMaximumColor
- Type:
- object
- Default:
- red
Gets or sets the maximum heat color for the density scale.
Code Sample
// Initialization $(".selector").igDataChart({ series: [{ name: "series1", type: "highDensityScatter", xAxis: "xAxis", yAxis: "yAxis", xMemberPath: "Index", yMemberPath: "Value1", heatMaximumColor: "red" }] }); // Get var series = $(".selector").igDataChart("option", "series"); series[0].heatMaximumColor; // Set $(".selector").igDataChart("option", "series", [{ name: "series1", type: "highDensityScatter", xAxis: "xAxis", yAxis: "yAxis", xMemberPath: "Index", yMemberPath: "Value1", heatMaximumColor: "red" }]); -
heatMinimum
- Type:
- number
- Default:
- 0
Gets or sets the density value that maps to the minimum heat color.
Code Sample
// Initialization $(".selector").igDataChart({ series: [{ name: "series1", type: "highDensityScatter", xAxis: "xAxis", yAxis: "yAxis", xMemberPath: "Index", yMemberPath: "Value1", heatMinimum: 5 }] }); // Get var series = $(".selector").igDataChart("option", "series"); series[0].heatMinimum; // Set $(".selector").igDataChart("option", "series", [{ name: "series1", type: "highDensityScatter", xAxis: "xAxis", yAxis: "yAxis", xMemberPath: "Index", yMemberPath: "Value1", heatMinimum: 5 }]); -
heatMinimumColor
- Type:
- object
- Default:
- black
Gets or sets the minimum heat color for the density scale.
Code Sample
// Initialization $(".selector").igDataChart({ series: [{ name: "series1", type: "highDensityScatter", xAxis: "xAxis", yAxis: "yAxis", xMemberPath: "Index", yMemberPath: "Value1", heatMinimumColor: "black" }] }); // Get var series = $(".selector").igDataChart("option", "series"); series[0].heatMinimumColor; // Set $(".selector").igDataChart("option", "series", [{ name: "series1", type: "highDensityScatter", xAxis: "xAxis", yAxis: "yAxis", xMemberPath: "Index", yMemberPath: "Value1", heatMinimumColor: "black" }]); -
highlightType
- Type:
- enumeration
- Default:
- auto
Gets or sets which type of highlight shape to use when highlighting items.
Members
- auto
- Type:string
- use an automatic highlight type for this series.
- marker
- Type:string
- use a marker highlight type for this series.
- shape
- Type:string
- use a shape highlight type for this series.
Code Sample
//Initialization <script type="text/javascript"> $(function () { $("#chart").igDataChart({ width: "100%", height: "400px", legend: { element: "lineLegend" }, title: "Population per Country", subtitle: "A comparision of population in 1995 and 2005", dataSource: data, axes: [ { name: "NameAxis", type: "categoryX", label: "CountryName" }, { name: "PopulationAxis", type: "numericY" } ], series: [ { name: "2005Population", type: "line", title: "2005", xAxis: "NameAxis", yAxis: "PopulationAxis", valueMemberPath: "Pop2005", isHighlightingEnabled: true, highlightType: "marker" } ] }); }); </script> //Get var series = $(".selector").igDataChart("option", "series"); series[0].highlightType; //Set $(".selector").igDataChart("option", "series", [{ name: "2005Population", type: "line", title: "2005", xAxis: "NameAxis", yAxis: "PopulationAxis", valueMemberPath: "Pop2005", isHighlightingEnabled: true, highlightType: "marker" }] ); -
highMemberPath
- Type:
- string
- Default:
- null
Gets or sets the value mapping property for the current series object.
Code Sample
//Initialization $(".selector").igDataChart({ axes: [{ name: "xAxis", type: "categoryX", dataSource: data, label: "Label" }, { name: "yAxis", type: "numericY" }], series: [{ name: "series1", dataSource: data, title: "Price", type: "financial", xAxis: "xAxis", yAxis: "yAxis", openMemberPath: "Open", highMemberPath: "High", lowMemberPath: "Low", closeMemberPath: "Close" }] }); //Get var series = $(".selector").igDataChart("option", "series"); series[0].highMemberPath; //Set $(".selector").igDataChart("option", "series", [{ name: "series1", dataSource: data, title: "Price", type: "financial", xAxis: "xAxis", yAxis: "yAxis", openMemberPath: "Open", highMemberPath: "High", lowMemberPath: "Low", closeMemberPath: "Close" }] ); -
hitTestMode
- Type:
- enumeration
- Default:
- auto
Gets or sets which type of hit testing the series should use.
Members
- auto
- Type:string
- automatically decide the appropriate hit test mode for the series.
- computational
- Type:string
- use a computational based approach to determine whether the series has been hit. This uses loose bounding boxes, in some cases, and can range in time complexity between O(1) and O(log n) to find a hit. This decreases frame render time compared to color encoded.
- colorEncoded
- Type:string
- use a color encoded off screen buffer for hit testing. This can have extremely rare false positives where the wrong series is hit (this is due to our inability to disable anti-aliasing in our color buffer), but should always be O(1) time for determining a hit series. This increases frame render time, however. Consider using this if hit testing time is degrading performance.
-
horizontalLineVisibility
- Type:
- bool
- Default:
- visible
Gets or sets whether the horizontal crosshair portion of the layer should be visible.
Code Sample
//Initialization <script type="text/javascript"> $(function () { $("#chart").igDataChart({ dataSource: data, axes: [{ type: "categoryX", name: "NameAxis", label: "CountryName", }, { type: "numericY", name: "PopulationAxis", }], series: [ { type: "column", name: "2005Population", xAxis: "NameAxis", yAxis: "PopulationAxis", valueMemberPath: "Pop2005" }, { type: "line", name: "1995Population", xAxis: "NameAxis", yAxis: "PopulationAxis", valueMemberPath: "Pop1995" }, { type: "crosshairLayer", name: "crosshairLayer", title: "crosshair", useInterpolation: false, transitionDuration: 500, targetSeries: "2005Population", horizontalLineVisibility: "visible" } ] }); }); </script> //Get var series = $(".selector").igDataChart("option", "series"); series[2].horizontalLineVisibilty; //Set $(".selector").igDataChart("option", "series", [{ name: "crosshairLayer", title: "crosshair", type: "crosshairLayer", horizontalLineVisiblity: "visible" }] ); -
ignoreFirst
- Type:
- number
- Default:
- 0
Gets or sets the number of values to hide at the beginning of the indicator.
Code Sample
//Initialization $(".selector").igDataChart({ axes: [{ name: "xAxis", type: "categoryX", dataSource: data, label: "Label" }, { name: "yAxis", type: "numericY" }], series: [{ name: "series1", dataSource: data, title: "Price", type: "financial", xAxis: "xAxis", yAxis: "yAxis", openMemberPath: "Open", highMemberPath: "High", lowMemberPath: "Low", closeMemberPath: "Close", ignoreFirst: 2 }] }); //Get var series = $(".selector").igDataChart("option", "series"); series[0].ignoreFirst; //Set $(".selector").igDataChart("option", "series", [{ name: "series1", dataSource: data, title: "Price", type: "financial", xAxis: "xAxis", yAxis: "yAxis", openMemberPath: "Open", highMemberPath: "High", lowMemberPath: "Low", closeMemberPath: "Close", ignoreFirst: 2 }] ); -
isCustomCategoryMarkerStyleAllowed
- Type:
- bool
- Default:
- false
Gets or sets whether a custom category marker style is allowed. Setting this to true will case the assigningCategoryMarkerStyle event to get fired, if provided.
Code Sample
//Initialization <script type="text/javascript"> $(function () { $("#chart").igDataChart({ dataSource: data, axes: [{ type: "categoryX", name: "NameAxis", label: "CountryName", }, { type: "numericY", name: "PopulationAxis", }], series: [{ type: "categoryHighlightLayer", name: "categoryHighlightLayer", title: "categoryHighlight", useInterpolation: false, transitionDuration: 500, targetSeries: "2005Population", isCustomCategoryMarkerStyleAllowed: "true" } ] }); }); </script> //Get var series = $(".selector").igDataChart("option", "series"); series[0].isCustomCategoryMarkerStyleAllowed; //Set $(".selector").igDataChart("option", "series", [{ type: "categoryHighlightLayer", name: "categoryHighlightLayer", title: "categoryHighlight", isCustomCategoryMarkerStyleAllowed: "true" }] ); -
isCustomCategoryStyleAllowed
- Type:
- bool
- Default:
- false
Gets or sets whether a custom category style is allowed. Setting this to true will case the assigningCategoryStyle event to get fired, if provided.
Code Sample
//Initialization <script type="text/javascript"> $(function () { $("#chart").igDataChart({ dataSource: data, axes: [{ type: "categoryX", name: "NameAxis", label: "CountryName", }, { type: "numericY", name: "PopulationAxis", }], series: [ { type: "categoryHighlightLayer", name: "categoryHighlightLayer", title: "categoryHighlight", useInterpolation: false, transitionDuration: 500, targetSeries: "2005Population", isCustomCategoryStyleAllowed: "true" } ] }); }); </script> //Get var series = $(".selector").igDataChart("option", "series"); series[0].isCustomCategoryStyleAllowed; //Set $(".selector").igDataChart("option", "series", [{ name: "crosshairLayer", title: "crosshair", type: "crosshairLayer", isCustomCategoryStyleAllowed: "true" }] ); -
isDefaultCrosshairDisabled
- Type:
- bool
- Default:
- true
Sets if the presence of this layer should disable the default crosshair behavior of the chart, if present.
Code Sample
//Initialization <script type="text/javascript"> $(function () { $("#chart").igDataChart({ dataSource: data, axes: [{ type: "categoryX", name: "NameAxis", label: "CountryName", }, { type: "numericY", name: "PopulationAxis", }], series: [ { type: "categoryHighlightLayer", name: "categoryHighlightLayer", title: "categoryHighlight", isDefaultCrosshairDisabled: "true" } ] }); }); </script> //Get var series = $(".selector").igDataChart("option", "series"); series[0].isDefaultCrosshairDisabled; //Set $(".selector").igDataChart("option", "series", [{ type: "categoryHighlightLayer", name: "categoryHighlightLayer", title: "categoryHighlight", isDefaultCrosshairDisabled: "true" }] ); -
isDropShadowEnabled
- Type:
- bool
- Default:
- false
Gets or sets whether drop shadow should be enabled for this series.
Code Sample
// Initialization $(".selector").igDataChart({ axes: [{ name: "xAxis", type: "categoryX", label: "Label" }, { name: "yAxis", type: "numericY" }], series: [{ name: "series1", title: "Sales", type: "column", xAxis: "xAxis", yAxis: "yAxis", valueMemberPath: "Value1", isDropShadowEnabled: true }] }); // Get var series = $(".selector").igDataChart("option", "series"); series[0].isDropShadowEnabled; // Set $(".selector").igDataChart("series", [{ name: "series1", isDropShadowEnabled: true }] ); -
isHighlightingEnabled
- Type:
- bool
- Default:
- false
Gets or sets whether highlighting should be enabled for the series, if supported.
Code Sample
//Initialization <script type="text/javascript"> $(function () { $("#chart").igDataChart({ dataSource: data, axes: [ { name: "NameAxis", type: "categoryX", label: "CountryName" }, { name: "PopulationAxis", type: "numericY", minimumValue: 0 } ], series: [ { name: "2005Population", type: "line", title: "2005", xAxis: "NameAxis", yAxis: "PopulationAxis", valueMemberPath: "Pop2005", isHighlightingEnabled: true }, { name: "1995Population", type: "line", title: "1995", xAxis: "NameAxis", yAxis: "PopulationAxis", valueMemberPath: "Pop1995", isHighlightingEnabled: true } ] }); }); </script> //Get var series = $(".selector").igDataChart("option", "series"); series[0].isHighlightingEnabled; //Set $(".selector").igDataChart("option", "series", [{ name: "2005Population", type: "line", title: "2005", xAxis: "NameAxis", yAxis: "PopulationAxis", valueMemberPath: "Pop2005", isHighlightingEnabled: true }] ); -
isTransitionInEnabled
- Type:
- bool
- Default:
- false
Gets or sets if the series should play a transition in animation when the data source is assigned. Note: Transitions are not currently supported for stacked series.
Code Sample
//Initialization <script type="text/javascript"> $(function () { $("#chart").igDataChart({ dataSource: data, axes: [ { name: "NameAxis", type: "categoryX", label: "CountryName" }, { name: "PopulationAxis", type: "numericY", } ], series: [ { name: "2005Population", type: "line", title: "2005", xAxis: "NameAxis", yAxis: "PopulationAxis", valueMemberPath: "Pop2005", isTransitionInEnabled: true }, { name: "1995Population", type: "line", title: "1995", xAxis: "NameAxis", yAxis: "PopulationAxis", valueMemberPath: "Pop1995", isTransitionInEnabled: true } ] }); }); </script> //Get var series = $(".selector").igDataChart("option", "series"); series[0].isTransitionInEnabled; //Set $(".selector").igDataChart("option", "series", [{ name: "2005Population", type: "line", title: "2005", xAxis: "NameAxis", yAxis: "PopulationAxis", valueMemberPath: "Pop2005", isTransitionInEnabled: true }] ); -
labelMemberPath
- Type:
- string
- Default:
- null
Gets or sets the Label mapping property for the current series object.
Code Sample
//Initialization $(".selector").igDataChart({ axes: [{ name: "xAxis", type: "numericX" }, { name: "yAxis", type: "numericY" }], series: [{ name: "series1", type: "bubble", xAxis: "xAxis", yAxis: "yAxis", xMemberPath: "Index", yMemberPath: "Value1", radiusMemberPath: "Value2", fillMemberPath: "Value3", labelMemberPath: "Value2" }] }); //Get var series = $(".selector").igDataChart("option", "series"); series[0].labelMemberPath; //Set $(".selector").igDataChart("option", "series", [{ name: "series1", type: "bubble", xAxis: "xAxis", yAxis: "yAxis", xMemberPath: "Index", yMemberPath: "Value1", radiusMemberPath: "Value2", fillMemberPath: "Value3", labelMemberPath: "Value2" }] ); -
legend
- Type:
- object
- Default:
- {}
Can be any valid options accepted by $.ig.ChartLegend, or an instance of an $.ig.ChartLegend itself.
Code Sample
//Initialization $(".selector").igDataChart({ axes: [{ name: "xAxis", type: "numericX" }, { name: "yAxis", type: "numericY" }], series: [{ name: "series1", type: "scatter", xAxis: "xAxis", yAxis: "yAxis", xMemberPath: "Index", yMemberPath: "Value1", legend: { element: "legend", type: "legend" } }] }); //Get var series = $(".selector").igDataChart("option", "series"); series[0].legend; //Set $(".selector").igDataChart("option", "series", [{ name: "series1", type: "scatter", xAxis: "xAxis", yAxis: "yAxis", xMemberPath: "Index", yMemberPath: "Value1", legend: { element: "legend", type: "legend" } }] );-
element
- Type:
- string
- Default:
- null
The name of the element to turn into a legend.
Code Sample
//Initialization $(".selector").igDataChart({ axes: [{ name: "xAxis", type: "numericX" }, { name: "yAxis", type: "numericY" }], series: [{ name: "series1", type: "scatter", xAxis: "xAxis", yAxis: "yAxis", xMemberPath: "Index", yMemberPath: "Value1", legend: { element: "legend", type: "legend" } }] }); //Get var series = $(".selector").igDataChart("option", "series"); series[0].legend.element; //Set $(".selector").igDataChart("option", "series", [{ name: "series1", type: "scatter", xAxis: "xAxis", yAxis: "yAxis", xMemberPath: "Index", yMemberPath: "Value1", legend: { element: "legend", type: "legend" } }] ); -
height
- Type:
- enumeration
- Default:
- null
The height of the legend. null will stretch vertically to fit data, no other height are defined.
Members
- null
- Type:object
- string
- The widget height can be set in pixels (px) and percentage (%).
- number
- The widget height can be set as a number.
Code Sample
//Initialization $(".selector").igDataChart({ axes: [{ name: "xAxis", type: "numericX" }, { name: "yAxis", type: "numericY" }], series: [{ name: "series1", type: "scatter", xAxis: "xAxis", yAxis: "yAxis", xMemberPath: "Index", yMemberPath: "Value1", legend: { element: "legend", type: "legend", height: "90px" } }] }); //Get var series = $(".selector").igDataChart("option", "series"); series[0].legend.height; //Set $(".selector").igDataChart("option", "series", [{ name: "series1", type: "scatter", xAxis: "xAxis", yAxis: "yAxis", xMemberPath: "Index", yMemberPath: "Value1", legend: { element: "legend", type: "legend", height: "90px" } }] ); -
type
- Type:
- enumeration
- Default:
- legend
Type of the legend.
Members
- item
- Type:string
- Specify the legend as item legend. It displays a legend item for each pie in the igPieChart control.
- legend
- Type:string
- Specify the legend as legend. It is supported by all types of series in the igDataChart control.
Code Sample
//Initialization $(".selector").igDataChart({ axes: [{ name: "xAxis", type: "numericX" }, { name: "yAxis", type: "numericY" }], series: [{ name: "series1", type: "scatter", xAxis: "xAxis", yAxis: "yAxis", xMemberPath: "Index", yMemberPath: "Value1", legend: { element: "legend", type: "legend" } }] }); //Get var series = $(".selector").igDataChart("option", "series"); series[0].legend.type; //Set $(".selector").igDataChart("option", "series", [{ name: "series1", type: "scatter", xAxis: "xAxis", yAxis: "yAxis", xMemberPath: "Index", yMemberPath: "Value1", legend: { element: "legend", type: "legend" } }] ); -
width
- Type:
- enumeration
- Default:
- null
The width of the legend.
Members
- null
- Type:object
- will stretch to fit data, if no other widths are defined.
- string
- The widget width can be set in pixels (px) and percentage (%).
- number
- The widget width can be set as a number.
Code Sample
//Initialization
$(".selector").igDataChart({
        axes: [{
            name: "xAxis",
            type: "numericX"
        }, {
            name: "yAxis",
            type: "numericY"
        }],
        series: [{
            name: "series1",
            type: "scatter",
            xAxis: "xAxis",
            yAxis: "yAxis",
            xMemberPath: "Index",
            yMemberPath: "Value1",
            legend: { element: "legend", type: "legend", width: "90px" }
        }]
    });

//Get
var series = $(".selector").igDataChart("option", "series");
series[0].legend.width;

//Set
$(".selector").igDataChart("option", "series",
        [{
            name: "series1",
            type: "scatter",
            xAxis: "xAxis",
            yAxis: "yAxis",
            xMemberPath: "Index",
            yMemberPath: "Value1",
            legend: { element: "legend", type: "legend", width: "90px" }
        }]
    );
-
legendItemBadgeTemplate
- Type:
- object
- Default:
- null
Gets or sets the LegendItemBadgeTemplate property.
The legend item badge is created according to the LegendItemBadgeTemplate on-demand by
the series object itself.
The provided object should have properties called render and optionally measure.
These are functions which will be called that will be called to handle the user specified custom rendering.
measure will be passed an object that looks like this:
{
context: [either a DOM element or a CanvasContext2D depending on the particular template scenario],
width: [if value is present, specifies the available width, user may set to desired width for content],
height: [if value is present, specifies the available height, user may set to desired height for content],
isConstant: [user should set to true if desired with and height will always be the same for this template],
data: [if present, represents the contextual data for this template]
}
render will be passed an object that looks like this:
{
context: [either a DOM element or a CanvasContext2D depending on the particular template scenario],
xPosition: [if present, specifies the x position at which to render the content],
yPosition: [if present, specifies the y position at which to render the content],
availableWidth: [if present, specifies the available width in which to render the content],
availableHeight: [if present, specifies the available height in which to render the content],
data: [if present, specifies the data that is in context for this content],
isHitTestRender: [if true, indicates that this is a special render pass for hit testing, in which case the brushes from the data should be used]
}.Code Sample
//Initialization $(".selector").igDataChart({ axes: [{ name: "xAxis", type: "numericX" }, { name: "yAxis", type: "numericY" }], series: [{ name: "series1", type: "scatter", xAxis: "xAxis", yAxis: "yAxis", xMemberPath: "Index", yMemberPath: "Value1", legend: { element: "legend", type: "legend" }, legendItemBadgeTemplate: { measure: function(measureInfo) { measureInfo.context; // either a DOM element or a CanvasContext2D depending on the particular template scenario measureInfo.width; // if value is present, specifies the available width, user may set to desired width for content measureInfo.height; // if value is present, specifies the available height, user may set to desired height for content measureInfo.isConstant; // user should set to true if desired with and height will always be the same for this template measureInfo.data; // if present, represents the contextual data for this template] }, render: function (renderInfo) { renderInfo.context; // either a DOM element or a CanvasContext2D depending on the particular template scenario renderInfo.xPosition; // if present, specifies the x position at which to render the content renderInfo.yPosition; // if present, specifies the y position at which to render the content renderInfo.availableWidth; // if present, specifies the available width in which to render the content renderInfo.availableHeight; // if present, specifies the available height in which to render the content renderInfo.data; // if present, specifies the data that is in context for this content renderInfo.isHitTestRender; // if true, indicates that this is a special render pass for hit testing, in which case the brushes from the data should be used } } }] }); -
legendItemTemplate
- Type:
- object
- Default:
- null
Gets or sets the LegendItemTemplate property.
The legend item control content is created according to the LegendItemTemplate on-demand by
the series object itself.
The provided object should have properties called render and optionally measure. See definition for option: legendItemBadgeTemplate.Code Sample
//Initialization $(".selector").igDataChart({ axes: [{ name: "xAxis", type: "numericX" }, { name: "yAxis", type: "numericY" }], series: [{ name: "series1", type: "scatter", xAxis: "xAxis", yAxis: "yAxis", xMemberPath: "Index", yMemberPath: "Value1", legend: { element: "legend", type: "legend" }, legendItemTemplate: { measure: function(measureInfo) { measureInfo.context; // either a DOM element or a CanvasContext2D depending on the particular template scenario measureInfo.width; // if value is present, specifies the available width, user may set to desired width for content measureInfo.height; // if value is present, specifies the available height, user may set to desired height for content measureInfo.isConstant; // user should set to true if desired with and height will always be the same for this template measureInfo.data; // if present, represents the contextual data for this template] }, render: function (renderInfo) { renderInfo.context; // either a DOM element or a CanvasContext2D depending on the particular template scenario renderInfo.xPosition; // if present, specifies the x position at which to render the content renderInfo.yPosition; // if present, specifies the y position at which to render the content renderInfo.availableWidth; // if present, specifies the available width in which to render the content renderInfo.availableHeight; // if present, specifies the available height in which to render the content renderInfo.data; // if present, specifies the data that is in context for this content renderInfo.isHitTestRender; // if true, indicates that this is a special render pass for hit testing, in which case the brushes from the data should be used } } }] }); -
legendItemVisibility
- Type:
- enumeration
- Default:
- visible
Gets or sets the legend item visibility for the current series object.
Members
- visible
- Type:string
- The legend item should be visible.
- collapsed
- Type:string
- The legend item should not be visible.
Code Sample
//Initialization $(".selector").igDataChart({ axes: [{ name: "xAxis", type: "numericX" }, { name: "yAxis", type: "numericY" }], series: [{ name: "series1", type: "scatter", xAxis: "xAxis", yAxis: "yAxis", xMemberPath: "Index", yMemberPath: "Value1", legend: { element: "legend", type: "legend" }, legendItemVisibility: "collapsed" }] }); //Get var series = $(".selector").igDataChart("option", "series"); series[0].legendItemVisibility; //Set $(".selector").igDataChart("option", "series", [{ name: "series1", type: "scatter", xAxis: "xAxis", yAxis: "yAxis", xMemberPath: "Index", yMemberPath: "Value1", legend: { element: "legend", type: "legend" }, legendItemVisibility: "collapsed" }] ); -
longPeriod
- Type:
- number
- Default:
- 0
Gets or sets the short moving average period for the current AbsoluteVolumeOscillatorIndicator object.
The typical, and initial, value for long AVO periods is 30.Code Sample
//Initialization $(".selector").igDataChart({ axes: [{ name: "xAxis", type: "categoryX", dataSource: data, label: "Label" }, { name: "yAxis", type: "numericY" }], series: [{ name: "series1", dataSource: data, title: "Price", type: "absoluteVolumeOscillatorIndicator", xAxis: "xAxis", yAxis: "yAxis", openMemberPath: "Open", highMemberPath: "High", lowMemberPath: "Low", closeMemberPath: "Close", longPeriod: 15 }] }); //Get var series = $(".selector").igDataChart("option", "series"); series[0].longPeriod; //Set $(".selector").igDataChart("option", "series", [{ name: "series1", dataSource: data, title: "Price", type: "absoluteVolumeOscillatorIndicator", xAxis: "xAxis", yAxis: "yAxis", openMemberPath: "Open", highMemberPath: "High", lowMemberPath: "Low", closeMemberPath: "Close", longPeriod: 15 }] ); -
lowMemberPath
- Type:
- string
- Default:
- null
Gets or sets the value mapping property for the current series object.
Code Sample
//Initialization $(".selector").igDataChart({ axes: [{ name: "xAxis", type: "categoryX", dataSource: data, label: "Label" }, { name: "yAxis", type: "numericY" }], series: [{ name: "series1", dataSource: data, title: "Price", type: "financial", xAxis: "xAxis", yAxis: "yAxis", openMemberPath: "Open", highMemberPath: "High", lowMemberPath: "Low", closeMemberPath: "Close" }] }); //Get var series = $(".selector").igDataChart("option", "series"); series[0].lowMemberPath; //Set $(".selector").igDataChart("option", "series", [{ name: "series1", dataSource: data, title: "Price", type: "financial", xAxis: "xAxis", yAxis: "yAxis", openMemberPath: "Open", highMemberPath: "High", lowMemberPath: "Low", closeMemberPath: "Close" }] ); -
markerBrush
- Type:
- string
- Default:
- null
Gets or sets the brush that specifies how the current series object's marker interiors are painted.
Code Sample
//Initialization $(".selector").igDataChart({ axes: [{ name: "xAxis", type: "numericX" }, { name: "yAxis", type: "numericY" }], series: [{ name: "series1", type: "scatter", xAxis: "xAxis", yAxis: "yAxis", xMemberPath: "Index", yMemberPath: "Value1", markerBrush: "blue", markerType: "automatic" }] }); //Get var series = $(".selector").igDataChart("option", "series"); series[0].markerBrush; //Set $(".selector").igDataChart("option", "series", [{ name: "series1", type: "scatter", xAxis: "xAxis", yAxis: "yAxis", xMemberPath: "Index", yMemberPath: "Value1", markerBrush: "blue", markerType: "automatic" }] ); -
markerCollisionAvoidance
- Type:
- enumeration
- Default:
- none
Gets or sets the MarkerCollisionAvoidance.
Members
- none
- Type:string
- No collision avoidance is attempted.
- omit
- Type:string
- Markers that collide will be omitted.
- fade
- Type:string
- Markers that collide will be faded in opacity.
- omitAndShift
- Type:string
- Markers that collide may be shifted or omitted.
Code Sample
//Initialization $(".selector").igDataChart({ axes: [{ name: "xAxis", type: "numericX" }, { name: "yAxis", type: "numericY" }], series: [{ name: "series1", type: "scatter", xAxis: "xAxis", yAxis: "yAxis", xMemberPath: "Index", yMemberPath: "Value1", markerCollisionAvoidance: "fade", markerType: "automatic" }] }); //Get var series = $(".selector").igDataChart("option", "series"); series[0].markerCollisionAvoidance; //Set $(".selector").igDataChart("option", "series", [{ name: "series1", type: "scatter", xAxis: "xAxis", yAxis: "yAxis", xMemberPath: "Index", yMemberPath: "Value1", markerCollisionAvoidance: "fade", markerType: "automatic" }] ); -
markerOutline
- Type:
- string
- Default:
- null
Gets or sets the brush that specifies how the current series object's marker outlines are painted.
Code Sample
//Initialization $(".selector").igDataChart({ axes: [{ name: "xAxis", type: "numericX" }, { name: "yAxis", type: "numericY" }], series: [{ name: "series1", type: "scatter", xAxis: "xAxis", yAxis: "yAxis", xMemberPath: "Index", yMemberPath: "Value1", markerOutline: "black", markerType: "automatic" }] }); //Get var series = $(".selector").igDataChart("option", "series"); series[0].markerOutline; //Set $(".selector").igDataChart("option", "series", [{ name: "series1", type: "scatter", xAxis: "xAxis", yAxis: "yAxis", xMemberPath: "Index", yMemberPath: "Value1", markerOutline: "black", markerType: "automatic" }] ); -
markerTemplate
- Type:
- object
- Default:
- null
Gets or sets the MarkerTemplate for the current series object.
The provided object should have properties called render and optionally measure. See definition for option: legendItemBadgeTemplate.Code Sample
//Initialization $(".selector").igDataChart({ axes: [{ name: "xAxis", type: "numericX" }, { name: "yAxis", type: "numericY" }], series: [{ name: "series1", type: "scatter", xAxis: "xAxis", yAxis: "yAxis", xMemberPath: "Index", yMemberPath: "Value1", markerType: "automatic", markerTemplate: { measure: function(measureInfo) { measureInfo.context; // either a DOM element or a CanvasContext2D depending on the particular template scenario measureInfo.width; // if value is present, specifies the available width, user may set to desired width for content measureInfo.height; // if value is present, specifies the available height, user may set to desired height for content measureInfo.isConstant; // user should set to true if desired with and height will always be the same for this template measureInfo.data; // if present, represents the contextual data for this template] }, render: function (renderInfo) { renderInfo.context; // either a DOM element or a CanvasContext2D depending on the particular template scenario renderInfo.xPosition; // if present, specifies the x position at which to render the content renderInfo.yPosition; // if present, specifies the y position at which to render the content renderInfo.availableWidth; // if present, specifies the available width in which to render the content renderInfo.availableHeight; // if present, specifies the available height in which to render the content renderInfo.data; // if present, specifies the data that is in context for this content renderInfo.isHitTestRender; // if true, indicates that this is a special render pass for hit testing, in which case the brushes from the data should be used } } }] }); -
markerType
- Type:
- enumeration
- Default:
- none
Gets or sets the marker type for the current series object. If the MarkerTemplate property is set, the setting of the MarkerType property will be ignored.
Members
- unset
- Type:string
- Marker hasn't been set.
- none
- Type:string
- No markerItems.
- automatic
- Type:string
- Automatic marker shape.
- circle
- Type:string
- Circle marker shape.
- triangle
- Type:string
- Flat-top triangle marker shape.
- pyramid
- Type:string
- Flat-base triangle marker shape.
- square
- Type:string
- Square marker shape.
- diamond
- Type:string
- Diamond marker shape.
- pentagon
- Type:string
- Pentagon marker shape.
- hexagon
- Type:string
- Hexagon marker shape.
- tetragram
- Type:string
- Four-pointed star marker shape.
- pentagram
- Type:string
- Five-pointed star marker shape.
- hexagram
- Type:string
- Six-pointed star marker shape.
Code Sample
//Initialization $(".selector").igDataChart({ axes: [{ name: "xAxis", type: "numericX" }, { name: "yAxis", type: "numericY" }], series: [{ name: "series1", type: "scatter", xAxis: "xAxis", yAxis: "yAxis", xMemberPath: "Index", yMemberPath: "Value1", markerType: "automatic" }] }); //Get var series = $(".selector").igDataChart("option", "series"); series[0].markerType; //Set $(".selector").igDataChart("option", "series", [{ name: "series1", type: "scatter", xAxis: "xAxis", yAxis: "yAxis", xMemberPath: "Index", yMemberPath: "Value1", markerType: "automatic" }] ); -
maximumMarkers
- Type:
- number
- Default:
- 400
Gets or sets the maximum number of markerItems displayed by the current series.
If more than the specified number of markerItems are visible, the series will automatically
choose a representative set.Code Sample
//Initialization $(".selector").igDataChart({ axes: [{ name: "xAxis", type: "numericX" }, { name: "yAxis", type: "numericY" }], series: [{ name: "series1", type: "scatter", xAxis: "xAxis", yAxis: "yAxis", xMemberPath: "Index", yMemberPath: "Value1", markerType: "automatic", maximumMarkers: 100 }] }); //Get var series = $(".selector").igDataChart("option", "series"); series[0].maximumMarkers; //Set $(".selector").igDataChart("option", "series", [{ name: "series1", type: "scatter", xAxis: "xAxis", yAxis: "yAxis", xMemberPath: "Index", yMemberPath: "Value1", markerType: "automatic", maximumMarkers: 100 }] ); -
mouseOverEnabled
- Type:
- bool
- Default:
- false
Gets or sets the whether the chart reacts to mouse move events.
Code Sample
//Initialization $(".selector").igDataChart({ axes: [{ name: "xAxis", type: "numericX" }, { name: "yAxis", type: "numericY" }], series: [{ name: "series1", type: "scatter", xAxis: "xAxis", yAxis: "yAxis", xMemberPath: "Index", yMemberPath: "Value1", markerType: "automatic", mouseOverEnabled: true }] }); //Get var series = $(".selector").igDataChart("option", "series"); series[0].mouseOverEnabled; //Set $(".selector").igDataChart("option", "series", [{ name: "series1", type: "scatter", xAxis: "xAxis", yAxis: "yAxis", xMemberPath: "Index", yMemberPath: "Value1", markerType: "automatic", mouseOverEnabled: true }] ); -
name
- Type:
- string
- Default:
- null
The unique identifier of the series.
Code Sample
//Initialization $(".selector").igDataChart({ axes: [{ name: "xAxis", type: "numericX" }, { name: "yAxis", type: "numericY" }], series: [{ name: "series1", type: "scatter", xAxis: "xAxis", yAxis: "yAxis", xMemberPath: "Index", yMemberPath: "Value1" }] }); //Get var series = $(".selector").igDataChart("option", "series"); series[0].name; //Set $(".selector").igDataChart("option", "series", [{ name: "series1", type: "scatter", xAxis: "xAxis", yAxis: "yAxis", xMemberPath: "Index", yMemberPath: "Value1" }] ); -
negativeBrush
- Type:
- string
- Default:
- null
Gets or sets the brush to use for negative portions of the series.
Code Sample
//Initialization $(".selector").igDataChart({ axes: [{ name: "xAxis", type: "categoryX", dataSource: data, label: "Label" }, { name: "yAxis", type: "numericY" }], series: [{ name: "series1", dataSource: data, title: "Price", type: "financial", xAxis: "xAxis", yAxis: "yAxis", openMemberPath: "Open", highMemberPath: "High", lowMemberPath: "Low", closeMemberPath: "Close", negativeBrush: "red" }] }); //Get var series = $(".selector").igDataChart("option", "series"); series[0].negativeBrush; //Set $(".selector").igDataChart("option", "series", [{ name: "series1", dataSource: data, title: "Price", type: "financial", xAxis: "xAxis", yAxis: "yAxis", openMemberPath: "Open", highMemberPath: "High", lowMemberPath: "Low", closeMemberPath: "Close", negativeBrush: "red" }] ); -
openMemberPath
- Type:
- string
- Default:
- null
Gets or sets the open mapping property for the current series object.
Code Sample
//Initialization $(".selector").igDataChart({ axes: [{ name: "xAxis", type: "categoryX", dataSource: data, label: "Label" }, { name: "yAxis", type: "numericY" }], series: [{ name: "series1", dataSource: data, title: "Price", type: "financial", xAxis: "xAxis", yAxis: "yAxis", openMemberPath: "Open", highMemberPath: "High", lowMemberPath: "Low", closeMemberPath: "Close" }] }); //Get var series = $(".selector").igDataChart("option", "series"); series[0].openMemberPath; //Set $(".selector").igDataChart("option", "series", [{ name: "series1", dataSource: data, title: "Price", type: "financial", xAxis: "xAxis", yAxis: "yAxis", openMemberPath: "Open", highMemberPath: "High", lowMemberPath: "Low", closeMemberPath: "Close" }] ); -
outline
- Type:
- string
- Default:
- null
Gets or sets the brush to use for the outline of the series.
Some series types, such as LineSeries, do not display outlines. Therefore, this property does not affect some charts.Code Sample
//Initialization $(".selector").igDataChart({ axes: [{ name: "xAxis", type: "numericX" }, { name: "yAxis", type: "numericY" }], series: [{ name: "series1", type: "scatter", xAxis: "xAxis", yAxis: "yAxis", xMemberPath: "Index", yMemberPath: "Value1", outline: "black" }] }); //Get var series = $(".selector").igDataChart("option", "series"); series[0].outline; //Set $(".selector").igDataChart("option", "series", [{ name: "series1", type: "scatter", xAxis: "xAxis", yAxis: "yAxis", xMemberPath: "Index", yMemberPath: "Value1", outline: "black" }] ); -
period
- Type:
- number
- Default:
- 0
Gets or sets the moving average period for the current AverageDirectionalIndexIndicator object.
The typical, and initial, value for AverageDirectionalIndexIndicator periods is 14.Code Sample
//Initialization $(".selector").igDataChart({ axes: [{ name: "xAxis", type: "categoryX", dataSource: data, label: "Label" }, { name: "yAxis", type: "numericY" }], series: [{ name: "series1", dataSource: data, title: "Price", type: "averageDirectionalIndexIndicator", xAxis: "xAxis", yAxis: "yAxis", openMemberPath: "Open", highMemberPath: "High", lowMemberPath: "Low", closeMemberPath: "Close", period: 7 }] }); //Get var series = $(".selector").igDataChart("option", "series"); series[0].period; //Set $(".selector").igDataChart("option", "series", [{ name: "series1", dataSource: data, title: "Price", type: "averageDirectionalIndexIndicator", xAxis: "xAxis", yAxis: "yAxis", openMemberPath: "Open", highMemberPath: "High", lowMemberPath: "Low", closeMemberPath: "Close", period: 7 }] ); -
progressiveLoad
- Type:
- bool
- Default:
- true
Gets or sets the whether to progressively load the data into the chart.
Code Sample
//Initialization $(".selector").igDataChart({ axes: [{ name: "xAxis", type: "numericX" }, { name: "yAxis", type: "numericY" }], series: [{ name: "series1", type: "scatter", xAxis: "xAxis", yAxis: "yAxis", xMemberPath: "Index", yMemberPath: "Value1", markerType: "automatic", progressiveLoad: false }] }); //Get var series = $(".selector").igDataChart("option", "series"); series[0].progressiveLoad; //Set $(".selector").igDataChart("option", "series", [{ name: "series1", type: "scatter", xAxis: "xAxis", yAxis: "yAxis", xMemberPath: "Index", yMemberPath: "Value1", markerType: "automatic", progressiveLoad: false }] ); -
radius
- Type:
- number
- Default:
- 2
Gets or sets the corner radius to use for the series, if applicable.
Code Sample
//Initialization $(".selector").igDataChart({ axes: [{ name: "angleAxis", type: "numericAngle" }, { name: "radius", type: "numericRadius" }], series: [{ name: "series1", title: "Sales", type: "polarScatter", angleAxis: "angleAxis", radius: "radius", angleMemberPath: "Index", radiusMemberPath: "Value1" }], }); //Get var series = $(".selector").igDataChart("option", "series"); series[0].radius; //Set $(".selector").igDataChart("option", "series", [{ name: "series1", title: "Sales", type: "polarScatter", angleAxis: "angleAxis", radius: "radius", angleMemberPath: "Index", radiusMemberPath: "Value1" }] ); -
radiusAxis
- Type:
- string
- Default:
- null
Gets the effective radius axis for the current series object.
Code Sample
//Initialization $(".selector").igDataChart({ axes: [{ name: "angleAxis", type: "numericAngle" }, { name: "radiusAxis", type: "numericRadius" }], series: [{ name: "series1", title: "Sales", type: "polarScatter", angleAxis: "angleAxis", radiusAxis: "radiusAxis", angleMemberPath: "Index", radiusMemberPath: "Value1" }], }); //Get var series = $(".selector").igDataChart("option", "series"); series[0].radiusAxis; //Set $(".selector").igDataChart("option", "series", [{ name: "series1", title: "Sales", type: "polarScatter", angleAxis: "angleAxis", radiusAxis: "radiusAxis", angleMemberPath: "Index", radiusMemberPath: "Value1" }] ); -
radiusMemberPath
- Type:
- string
- Default:
- null
Gets or sets the radius mapping property for the current series object.
Code Sample
//Initialization $(".selector").igDataChart({ axes: [{ name: "angleAxis", type: "numericAngle" }, { name: "radiusAxis", type: "numericRadius" }], series: [{ name: "series1", title: "Sales", type: "polarScatter", angleAxis: "angleAxis", radiusAxis: "radiusAxis", angleMemberPath: "Index", radiusMemberPath: "Value1" }], }); //Get var series = $(".selector").igDataChart("option", "series"); series[0].radiusMemberPath; //Set $(".selector").igDataChart("option", "series", [{ name: "series1", title: "Sales", type: "polarScatter", angleAxis: "angleAxis", radiusAxis: "radiusAxis", angleMemberPath: "Index", radiusMemberPath: "Value1" }] ); -
radiusScale
- Type:
- object
- Default:
- null
Gets or sets the radius size scale for the bubbles.
Code Sample
//Initialization $(".selector").igDataChart({ axes: [{ name: "xAxis", type: "numericX" }, { name: "yAxis", type: "numericY" }], series: [{ name: "series1", type: "bubble", xAxis: "xAxis", yAxis: "yAxis", xMemberPath: "Index", yMemberPath: "Value1", radiusMemberPath: "Value2", fillMemberPath: "Value3", labelMemberPath: "Value2", radiusScale: { minimumValue: 0, maximumValue: 20, isLogarithmic: "true", logarithmicBase: 2 } }] }); //Get var series = $(".selector").igDataChart("option", "series"); series[0].radiusScale; //Set $(".selector").igDataChart("option", "series", [{ name: "series1", type: "bubble", xAxis: "xAxis", yAxis: "yAxis", xMemberPath: "Index", yMemberPath: "Value1", radiusMemberPath: "Value2", fillMemberPath: "Value3", labelMemberPath: "Value2", radiusScale: { type: "value", brushes: ["red", "blue"], minimumValue: 0, maximumValue: 20 } }] ); -
radiusX
- Type:
- number
- Default:
- 2.0
Gets or sets the x-radius of the ellipse that is used to round the corners of the column.
Code Sample
//Initialization $(".selector").igDataChart({ series: [{ name: "series1", type: "column", radiusX: 5.5 }] }); //Get var series = $(".selector").igDataChart("option", "series"); series[0].radiusX; //Set $(".selector").igDataChart("option", "series", [{ name: "series1", type: "column", radiusX: 5.5 }] ); -
radiusY
- Type:
- number
- Default:
- 2.0
Gets or sets the y-radius of the ellipse that is used to round the corners of the column.
Code Sample
//Initialization $(".selector").igDataChart({ series: [{ name: "series1", type: "column", radiusY: 5.5 }] }); //Get var series = $(".selector").igDataChart("option", "series"); series[0].radiusY; //Set $(".selector").igDataChart("option", "series", [{ name: "series1", type: "column", radiusY: 5.5 }] ); -
remove
- Type:
- bool
- Default:
- false
Set to true in order to have an existing series removed from the chart, by name.
Code Sample
//Set $(".selector").igDataChart("option", "series", [{ name: "series1", remove: true }] ); -
resolution
- Type:
- number
- Default:
- 1
Gets or sets the current series object's rendering resolution.
Code Sample
//Initialization $(".selector").igDataChart({ axes: [{ name: "xAxis", type: "numericX" }, { name: "yAxis", type: "numericY" }], series: [{ name: "series1", type: "scatter", xAxis: "xAxis", yAxis: "yAxis", xMemberPath: "Index", yMemberPath: "Value1", resolution: 3 }] }); //Get var series = $(".selector").igDataChart("option", "series"); series[0].resolution; //Set $(".selector").igDataChart("option", "series", [{ name: "series1", type: "scatter", xAxis: "xAxis", yAxis: "yAxis", xMemberPath: "Index", yMemberPath: "Value1", resolution: 3 }] ); -
responseDataKey
- Type:
- string
- Default:
- null
See $.ig.DataSource. Specifies the name of the property in which data records are held if the response is wrapped.
Code Sample
//Initialization $(".selector").igDataChart({ axes: [{ name: "xAxis", type: "categoryX", dataSource: data, label: "Label" }, { name: "yAxis", type: "numericY" }], series: [{ name: "series1", dataSource: data, responseDataKey: "Records", title: "Price", type: "financial", xAxis: "xAxis", yAxis: "yAxis", openMemberPath: "Open", highMemberPath: "High", lowMemberPath: "Low", closeMemberPath: "Close" }] }); //Get var series = $(".selector").igDataChart("option", "series"); series[0].responseDataKey; //Set $(".selector").igDataChart("option", "series", [{ name: "series1", dataSource: data, responseDataKey: "Records", title: "Price", type: "financial", xAxis: "xAxis", yAxis: "yAxis", openMemberPath: "Open", highMemberPath: "High", lowMemberPath: "Low", closeMemberPath: "Close" }] ); -
series
- Type:
- array
- Default:
- null
- Elements Type:
Gets or sets the series for stacked charts. It should contain array of series objects. Each item in array should represent a series with and it may have most options supported by top-level series object, such as xAxis, yAxis, valueMemberPath, etc.
-
shadowBlur
- Type:
- number
- Default:
- 10
Gets or sets the blur amount to use for the drop shadow.
Code Sample
// Initialization $(".selector").igDataChart({ axes: [{ name: "xAxis", type: "categoryX", label: "Label" }, { name: "yAxis", type: "numericY" }], series: [{ name: "series1", title: "Sales", type: "column", xAxis: "xAxis", yAxis: "yAxis", valueMemberPath: "Value1", shadowBlur: 7 }] }); // Get var series = $(".selector").igDataChart("option", "series"); series[0].shadowBlur; // Set $(".selector").igDataChart("option", "series", [{ name: "series1", shadowBlur: 7 }] ); -
shadowColor
- Type:
- object
- Default:
- rgba(95,95,95,0.5)
Gets or sets the color to use for the drop shadow.
Code Sample
// Initialization $(".selector").igDataChart({ axes: [{ name: "xAxis", type: "categoryX", label: "Label" }, { name: "yAxis", type: "numericY" }], series: [{ name: "series1", title: "Sales", type: "column", xAxis: "xAxis", yAxis: "yAxis", valueMemberPath: "Value1", shadowColor: "blue" }] }); // Get var series = $(".selector").igDataChart("option", "series"); series[0].shadowColor; // Set $(".selector").igDataChart("option", "series", [{ name: "series1", shadowColor: "blue" }] ); -
shadowOffsetX
- Type:
- number
- Default:
- 5
Gets or sets the x offset amount to use for the drop shadow.
Code Sample
// Initialization $(".selector").igDataChart({ axes: [{ name: "xAxis", type: "categoryX", label: "Label" }, { name: "yAxis", type: "numericY" }], series: [{ name: "series1", title: "Sales", type: "column", xAxis: "xAxis", yAxis: "yAxis", valueMemberPath: "Value1", shadowOffsetX: 10 }] }); // Get var series = $(".selector").igDataChart("option", "series"); series[0].shadowOffsetX; // Set $(".selector").igDataChart("option", "series", [{ name: "series1", shadowOffsetX: 10 }] ); -
shadowOffsetY
- Type:
- number
- Default:
- 5
Gets or sets the y offset amount to use for the drop shadow.
Code Sample
// Initialization $(".selector").igDataChart({ axes: [{ name: "xAxis", type: "categoryX", label: "Label" }, { name: "yAxis", type: "numericY" }], series: [{ name: "series1", title: "Sales", type: "column", xAxis: "xAxis", yAxis: "yAxis", valueMemberPath: "Value1", shadowOffsetY: 10 }] }); // Get var series = $(".selector").igDataChart("option", "series"); series[0].shadowOffsetY; // Set $(".selector").igDataChart("option", "series", [{ name: "series1", shadowOffsetY: 10 }] ); -
shortPeriod
- Type:
- number
- Default:
- 0
Gets or sets the short moving average period for the current AbsoluteVolumeOscillatorIndicator object.
The typical, and initial, value for short AVO periods is 10.Code Sample
//Initialization $(".selector").igDataChart({ axes: [{ name: "xAxis", type: "categoryX", dataSource: data, label: "Label" }, { name: "yAxis", type: "numericY" }], series: [{ name: "series1", dataSource: data, title: "Price", type: "absoluteVolumeOscillatorIndicator", xAxis: "xAxis", yAxis: "yAxis", openMemberPath: "Open", highMemberPath: "High", lowMemberPath: "Low", closeMemberPath: "Close", shortPeriod: 7 }] }); //Get var series = $(".selector").igDataChart("option", "series"); series[0].shortPeriod; //Set $(".selector").igDataChart("option", "series", [{ name: "series1", dataSource: data, title: "Price", type: "absoluteVolumeOscillatorIndicator", xAxis: "xAxis", yAxis: "yAxis", openMemberPath: "Open", highMemberPath: "High", lowMemberPath: "Low", closeMemberPath: "Close", shortPeriod: 7 }] ); -
showTooltip
- Type:
- bool
- Default:
- false
Whether the chart should render a tooltip.
Code Sample
//Initialization $(".selector").igDataChart({ axes: [{ name: "xAxis", type: "numericX" }, { name: "yAxis", type: "numericY" }], series: [{ name: "series1", type: "scatter", xAxis: "xAxis", yAxis: "yAxis", xMemberPath: "Index", yMemberPath: "Value1", showTooltip: true, tooltipTemplate: "template" }] }); //Get var series = $(".selector").igDataChart("option", "series"); series[0].showTooltip; //Set $(".selector").igDataChart("option", "series", [{ name: "series1", type: "scatter", xAxis: "xAxis", yAxis: "yAxis", xMemberPath: "Index", yMemberPath: "Value1", showTooltip: true, tooltipTemplate: "template" }] ); -
skipUnknownValues
- Type:
- bool
- Default:
- false
Gets or sets whether the hover layer should skip unknown values when trying to find the closest values.
-
splineType
- Type:
- enumeration
- Default:
- natural
Gets or sets the type of spline to be rendered.
Members
- natural
- Type:string
- Calculates the spline using a natural spline calculation formula.
- clamped
- Type:string
- Calculated the spline using a clamped spline calculation formula.
Code Sample
// Initialization $(".selector").igDataChart({ axes: [{ name: "xAxis", type: "categoryX", dataSource: data, label: "Label" }, { name: "yAxis", type: "numericY" }], series: [{ name: "series1", dataSource: data, title: "Price Series 1", type: "spline", splineType: "clamped", xAxis: "xAxis", yAxis: "yAxis", valueMemberPath: "Item1" }] }); // Get var series = $(".selector").igDataChart("option", "series"); series[0].splineType; // Set $(".selector").igDataChart("option", "series", [{ name: "series1", dataSource: data, title: "Price Series 1", type: "spline", splineType: "clamped", xAxis: "xAxis", yAxis: "yAxis", valueMemberPath: "Item1" }] ); -
targetAxis
- Type:
- string
- Default:
- null
Gets or sets the name of the target axis for the layer, if desired. Setting the target axis will scope the layer to target just that axis.
Code Sample
//Initialization <script type="text/javascript"> $(function () { $("#chart").igDataChart({ dataSource: data, axes: [{ type: "categoryX", name: "NameAxis", label: "CountryName", }, { type: "numericY", name: "PopulationAxis", }], series: [ { type: "column", name: "2005Population", xAxis: "NameAxis", yAxis: "PopulationAxis", valueMemberPath: "Pop2005" }, { type: "line", name: "1995Population", xAxis: "NameAxis", yAxis: "PopulationAxis", valueMemberPath: "Pop1995" }, { type: "categoryHighlightLayer", name: "catHighlightLayer", title: "categoryHighlight", useInterpolation: false, transitionDuration: 500, bandHighlightWidth: 50, targetAxis: "PopulationAxis" } ] }); }); </script> //Get var series = $(".selector").igDataChart("option", "series"); series[2].targetAxis; //Set $(".selector").igDataChart("option", "series", [{ type: "categoryHighlightLayer", name: "catHighlightLayer", title: "categoryHighlight", targetAxis: "PopulationAxis" }] ); -
targetSeries
- Type:
- string
- Default:
- null
Gets or sets the name of the target series for the layer, if desired. Setting the target series will scope the layer to target just that series.
Code Sample
//Initialization <script type="text/javascript"> $(function () { $("#chart").igDataChart({ dataSource: data, axes: [{ type: "categoryX", name: "NameAxis", label: "CountryName", }, { type: "numericY", name: "PopulationAxis", }], series: [ { type: "column", name: "2005Population", xAxis: "NameAxis", yAxis: "PopulationAxis", valueMemberPath: "Pop2005" }, { type: "line", name: "1995Population", xAxis: "NameAxis", yAxis: "PopulationAxis", valueMemberPath: "Pop1995" }, { type: "crosshairLayer", name: "crosshairLayer", title: "crosshair", useInterpolation: false, transitionDuration: 500, targetSeries: "2005Population" } ] }); }); </script> //Get var series = $(".selector").igDataChart("option", "series"); series[2].targetSeries; //Set $(".selector").igDataChart("option", "series", [{ name: "crosshairLayer", title: "crosshair", type: "crosshairLayer", targetSeries: "2005Population" }] ); -
thickness
- Type:
- number
- Default:
- 0
Gets or sets the width of the current series object's line thickness.
Code Sample
// Initialization $(".selector").igDataChart({ axes: [{ name: "xAxis", type: "categoryX", dataSource: data, label: "Label" }, { name: "yAxis", type: "numericY" }], series: [{ name: "series1", dataSource: data, title: "Price Series 1", type: "line", thickness: 5, xAxis: "xAxis", yAxis: "yAxis", valueMemberPath: "Item1" }] }); // Get var series = $(".selector").igDataChart("option", "series"); series[0].thickness; // Set $(".selector").igDataChart("option", "series", [{ name: "series1", dataSource: data, title: "Price Series 1", type: "line", thickness: 5, xAxis: "xAxis", yAxis: "yAxis", valueMemberPath: "Item1" }] ); -
title
- Type:
- string
- Default:
- null
Gets or sets the Title property.
The legend item control is created according to the Title on-demand by
the series object itself.Code Sample
// Initialization $(".selector").igDataChart({ axes: [{ name: "xAxis", type: "categoryX", dataSource: data, label: "Label" }, { name: "yAxis", type: "numericY" }], series: [{ name: "series1", dataSource: data, title: "Price Series 1", type: "line", xAxis: "xAxis", yAxis: "yAxis", valueMemberPath: "Item1" }] }); // Get var series = $(".selector").igDataChart("option", "series"); series[0].title; // Set $(".selector").igDataChart("option", "series", [{ name: "series1", dataSource: data, title: "Price Series 1", type: "line", xAxis: "xAxis", yAxis: "yAxis", valueMemberPath: "Item1" }] ); -
tooltipPosition
- Type:
- enumeration
- Default:
- auto
Gets or sets the Position to apply to the tooltip containers.
Members
- auto
- Type:string
- use an automatic position for the category tooltips.
- outsideStart
- Type:string
- position the category tooltip at the outside start of the value axis.
- insideStart
- Type:string
- position the category tooltip at the inside start of the value axis.
- insideEnd
- Type:string
- position the category tooltip at the inside end of the value axis.
- outsideEnd
- Type:string
- position the category tooltip at the outside end of the value axis.
Code Sample
//Initialization <script type="text/javascript"> $(function () { $("#chart").igDataChart({ dataSource: data, axes: [{ type: "categoryX", name: "NameAxis", label: "CountryName", }, { type: "numericY", name: "PopulationAxis", }], series: [ { type: "categoryToolTipLayer", name: "catToolTipLayer", title: "categoryToolTip", toolTipPosition: "insideStart" } ] }); }); </script> //Get var series = $(".selector").igDataChart("option", "series"); series[0].toolTipPosition; //Set $(".selector").igDataChart("option", "series", [{ type: "categoryToolTipLayer", name: "catToolTipLayer", title: "categoryToolTip", toolTipPosition: "insideStart" }] ); -
tooltipTemplate
- Type:
- string
- Default:
- null
The name of template or the template itself that chart tooltip will use to render.
Code Sample
//Initialization $(".selector").igDataChart({ series: [{ name: "series1", type: "column", showTooltip: true, tooltipTemplate: "cityTooltip" }] }); //Get var series = $(".selector").igDataChart("option", "series"); series[0].tooltipTemplate; //Set $(".selector").igDataChart("option", "series", [{ name: "series1", type: "column", showTooltip: true, tooltipTemplate: "cityTooltip" }] ); -
transitionDuration
- Type:
- number
- Default:
- 0
Gets or sets the duration of the current series's morph.
Code Sample
// Initialization $(".selector").igDataChart({ axes: [{ name: "xAxis", type: "categoryX", dataSource: data, label: "Label" }, { name: "yAxis", type: "numericY" }], series: [{ name: "series1", dataSource: data1, title: "Price Series 1", type: "column", xAxis: "xAxis", yAxis: "yAxis", valueMemberPath: "Item1", transitionDuration: 500 }] }); // Get var series = $(".selector").igDataChart("option", "series"); series[0].transitionDuration; // Set $(".selector").igDataChart("option", "series", [{ name: "series1", dataSource: data1, title: "Price Series 1", type: "column", xAxis: "xAxis", yAxis: "yAxis", valueMemberPath: "Item1", transitionDuration: 500 }] ); -
transitionEasingFunction
- Type:
- object
- Default:
- null
Provides an easing function to use for the transitions. This should either be a well known name of an easing function (The only currently supported name is cubic), or it should be a function that takes a number and returns the output with the function applied.
Code Sample
//Initialization <script type="text/javascript"> $(function () { $("#chart").igDataChart({ dataSource: data, axes: [ { name: "NameAxis", type: "categoryX", label: "CountryName" }, { name: "PopulationAxis", type: "numericY", minimumValue: 0, } ], series: [ { name: "2005Population", type: "line", title: "2005", xAxis: "NameAxis", yAxis: "PopulationAxis", valueMemberPath: "Pop2005", isTransitionInEnabled: true, transitionEasingFunction: "cubic" } ] }); }); </script> //Get var series = $(".selector").igDataChart("option", "series"); series[0].transitionEasingFunction; //Set $(".selector").igDataChart("option", "series", [{ name: "2005Population", type: "line", title: "2005", xAxis: "NameAxis", yAxis: "PopulationAxis", valueMemberPath: "Pop2005", isTransitionInEnabled: true, transitionEasingFunction: "cubic" }] ); -
transitionInDuration
- Type:
- number
- Default:
- 500
Gets or sets the duration of the current series's transition in morph in milliseconds.
Code Sample
//Initialization <script type="text/javascript"> $(function () { $("#chart").igDataChart({ dataSource: data, axes: [ { name: "NameAxis", type: "categoryX", label: "CountryName" }, { name: "PopulationAxis", type: "numericY", minimumValue: 0, } ], series: [ { name: "2005Population", type: "line", title: "2005", xAxis: "NameAxis", yAxis: "PopulationAxis", valueMemberPath: "Pop2005", isTransitionInEnabled: true, transitionInDuration: 500 } ] }); }); </script> //Get var series = $(".selector").igDataChart("option", "series"); series[0].transitionInDuration; //Set $(".selector").igDataChart("option", "series", [{ name: "2005Population", type: "line", title: "2005", xAxis: "NameAxis", yAxis: "PopulationAxis", valueMemberPath: "Pop2005", isTransitionInEnabled: true, transitionInDuration: 500 }] ); -
transitionInMode
- Type:
- enumeration
- Default:
- auto
Gets or sets the method to transition in the series. Note: Transitions are not currently supported for stacked series.
Members
- auto
- Type:string
- Series transitions in an automatically chosen way.
- fromZero
- Type:string
- Series transitions in from the reference value of the value axis.
- sweepFromLeft
- Type:string
- Series sweeps in from the left.
- sweepFromRight
- Type:string
- Series sweeps in from the right.
- sweepFromTop
- Type:string
- Series sweeps in from the top.
- sweepFromBottom
- Type:string
- Series sweeps in from the bottom.
- sweepFromCenter
- Type:string
- Series sweeps in from the center.
- accordionFromLeft
- Type:string
- Series accordions in from the left.
- accordionFromRight
- Type:string
- Series accordions in from the right.
- accordionFromTop
- Type:string
- Series accordions in from the top.
- accordionFromBottom
- Type:string
- Series accordions in from the bottom.
- expand
- Type:string
- Series expands from the value midpoints.
- sweepFromCategoryAxisMinimum
- Type:string
- Series sweeps in from the category axis minimum.
- sweepFromCategoryAxisMaximum
- Type:string
- Series sweeps in from the category axis maximum.
- sweepFromValueAxisMinimum
- Type:string
- Series sweeps in from the value axis minimum.
- sweepFromValueAxisMaximum
- Type:string
- Series sweeps in from the value axis maximum.
- accordionFromCategoryAxisMinimum
- Type:string
- Series accordions in from the category axis minimum.
- accordionFromCategoryAxisMaximum
- Type:string
- Series accordions in from the category axis maximum.
- accordionFromValueAxisMinimum
- Type:string
- Series accordions in from the value axis minimum.
- accordionFromValueAxisMaximum
- Type:string
- Series accordions in from the value axis maximum.
Code Sample
//Initialization <script type="text/javascript"> $(function () { $("#chart").igDataChart({ dataSource: data, axes: [ { name: "NameAxis", type: "categoryX", label: "CountryName" }, { name: "PopulationAxis", type: "numericY", minimumValue: 0, } ], series: [ { name: "2005Population", type: "line", title: "2005", xAxis: "NameAxis", yAxis: "PopulationAxis", valueMemberPath: "Pop2005", isTransitionInEnabled: true, transitionInMode: "sweepFromRight" } ] }); }); </script> //Get var series = $(".selector").igDataChart("option", "series"); series[0].isTransitionInMode; //Set $(".selector").igDataChart("option", "series", [{ name: "2005Population", type: "line", title: "2005", xAxis: "NameAxis", yAxis: "PopulationAxis", valueMemberPath: "Pop2005", isTransitionInEnabled: true, transitionInMode: "sweepFromRight" }] ); -
transitionInSpeedType
- Type:
- enumeration
- Default:
- auto
Gets or sets the speed to transition in the series data points.
Members
- auto
- Type:string
- A speed type is automatically selected.
- normal
- Type:string
- All speeds are normal, data points will arrive at the same time.
- valueScaled
- Type:string
- Data points will arrive later if their value is further from the start point.
- indexScaled
- Type:string
- Data points will arrive later if their index is further from the axis origin.
- random
- Type:string
- Data points will arrive at random times.
Code Sample
//Initialization <script type="text/javascript"> $(function () { $("#chart").igDataChart({ dataSource: data, axes: [ { name: "NameAxis", type: "categoryX", label: "CountryName" }, { name: "PopulationAxis", type: "numericY" } ], series: [ { name: "2005Population", type: "line", title: "2005", xAxis: "NameAxis", yAxis: "PopulationAxis", valueMemberPath: "Pop2005", isTransitionInEnabled: true, transitionInSpeedType: "indexScaled" }, { name: "1995Population", type: "line", title: "1995", xAxis: "NameAxis", yAxis: "PopulationAxis", valueMemberPath: "Pop1995", isTransitionInEnabled: true, transitionInSpeedType: "indexScaled" } ] }); }); </script> //Get var series = $(".selector").igDataChart("option", "series"); series[0].transitionInSpeedType; //Set $(".selector").igDataChart("option", "series", [{ name: "2005Population", type: "line", title: "2005", xAxis: "NameAxis", yAxis: "PopulationAxis", valueMemberPath: "Pop2005", isTransitionInEnabled: true, transitionInSpeedType: "indexScaled" }] ); -
trendLineBrush
- Type:
- string
- Default:
- null
Gets or sets the brush to use to draw the trend line.
Code Sample
// Initialization $(".selector").igDataChart({ axes: [{ name: "xAxis", type: "categoryX", dataSource: data, label: "Label" }, { name: "yAxis", type: "numericY" }], series: [{ name: "series1", dataSource: data, title: "Price", type: "financial", xAxis: "xAxis", yAxis: "yAxis", openMemberPath: "Open", highMemberPath: "High", lowMemberPath: "Low", closeMemberPath: "Close", trendLineType: "exponentialAverage", trendLineBrush: "grey" }] }); // Get var series = $(".selector").igDataChart("option", "series"); series[0].trendLineBrush; // Set $(".selector").igDataChart("option", "series", [{ name: "series1", dataSource: data, title: "Price", type: "financial", xAxis: "xAxis", yAxis: "yAxis", openMemberPath: "Open", highMemberPath: "High", lowMemberPath: "Low", closeMemberPath: "Close", trendLineType: "exponentialAverage", trendLineBrush: "grey" }] ); -
trendLinePeriod
- Type:
- number
- Default:
- 7
Gets or sets the moving average period for the current scatter series object.
The typical, and initial, value for trend line period is 7.Code Sample
// Initialization $(".selector").igDataChart({ axes: [{ name: "xAxis", type: "categoryX", dataSource: data, label: "Label" }, { name: "yAxis", type: "numericY" }], series: [{ name: "series1", dataSource: data, title: "Price", type: "financial", xAxis: "xAxis", yAxis: "yAxis", openMemberPath: "Open", highMemberPath: "High", lowMemberPath: "Low", closeMemberPath: "Close", trendLineType: "simpleAverage", trendLinePeriod: 5 }] }); //Get var series = $(".selector").igDataChart("option", "series"); series[0].trendLinePeriod; //Set $(".selector").igDataChart("option", "series", [{ name: "series1", dataSource: data, title: "Price", type: "financial", xAxis: "xAxis", yAxis: "yAxis", openMemberPath: "Open", highMemberPath: "High", lowMemberPath: "Low", closeMemberPath: "Close", trendLineType: "simpleAverage", trendLinePeriod: 5 }] ); -
trendLineThickness
- Type:
- number
- Default:
- 1.5
Gets or sets the thickness of the current scatter series object's trend line.
Code Sample
// Initialization $(".selector").igDataChart({ axes: [{ name: "xAxis", type: "categoryX", dataSource: data, label: "Label" }, { name: "yAxis", type: "numericY" }], series: [{ name: "series1", dataSource: data, title: "Price", type: "financial", xAxis: "xAxis", yAxis: "yAxis", openMemberPath: "Open", highMemberPath: "High", lowMemberPath: "Low", closeMemberPath: "Close", trendLineType: "simpleAverage", trendLineThickness: 3 }] }); //Get var series = $(".selector").igDataChart("option", "series"); series[0].trendLineThickness; //Set $(".selector").igDataChart("option", "series", [{ name: "series1", dataSource: data, title: "Price", type: "financial", xAxis: "xAxis", yAxis: "yAxis", openMemberPath: "Open", highMemberPath: "High", lowMemberPath: "Low", closeMemberPath: "Close", trendLineType: "simpleAverage", trendLineThickness: 3 }] ); -
trendLineType
- Type:
- enumeration
- Default:
- none
Gets or sets the trend type for the current scatter series.
Members
- none
- Type:string
- No trendline should display.
- linearFit
- Type:string
- Linear fit.
- quadraticFit
- Type:string
- Quadratic polynomial fit.
- cubicFit
- Type:string
- Cubic polynomial fit.
- quarticFit
- Type:string
- Quartic polynomial fit.
- quinticFit
- Type:string
- Quintic polynomial fit.
- logarithmicFit
- Type:string
- Logarithmic fit.
- exponentialFit
- Type:string
- Exponential fit.
- powerLawFit
- Type:string
- Powerlaw fit.
- simpleAverage
- Type:string
- Simple moving average.
- exponentialAverage
- Type:string
- Exponential moving average.
- modifiedAverage
- Type:string
- Modified moving average.
- cumulativeAverage
- Type:string
- Cumulative moving average.
- weightedAverage
- Type:string
- Weighted moving average.
Code Sample
//Initialization $(".selector").igDataChart({ axes: [{ name: "xAxis", type: "categoryX", dataSource: data, label: "Label" }, { name: "yAxis", type: "numericY" }], series: [{ name: "series1", dataSource: data, title: "Price", type: "financial", xAxis: "xAxis", yAxis: "yAxis", openMemberPath: "Open", highMemberPath: "High", lowMemberPath: "Low", closeMemberPath: "Close", trendLineType: "simpleAverage" }] }); //Get var series = $(".selector").igDataChart("option", "series"); series[0].trendLineType; //Set $(".selector").igDataChart("option", "series", [{ name: "series1", dataSource: data, title: "Price", type: "financial", xAxis: "xAxis", yAxis: "yAxis", openMemberPath: "Open", highMemberPath: "High", lowMemberPath: "Low", closeMemberPath: "Close", trendLineType: "simpleAverage" }] ); -
trendLineZIndex
- Type:
- number
- Default:
- 1001
Gets or sets the Z-Index of the trend line. Values greater than 1000 will result in the trend line being rendered in front of the series data.
Code Sample
//Initialization $(".selector").igDataChart({ axes: [{ name: "xAxis", type: "categoryX", dataSource: data, label: "Label" }, { name: "yAxis", type: "numericY" }], series: [{ name: "series1", dataSource: data, title: "Price", type: "financial", xAxis: "xAxis", yAxis: "yAxis", openMemberPath: "Open", highMemberPath: "High", lowMemberPath: "Low", closeMemberPath: "Close", trendLineType: "simpleAverage", trendLineZIndex: 1200 }] }); //Get var series = $(".selector").igDataChart("option", "series"); series[0].trendLineZIndex; //Set $(".selector").igDataChart("option", "series", [{ name: "series1", dataSource: data, title: "Price", type: "financial", xAxis: "xAxis", yAxis: "yAxis", openMemberPath: "Open", highMemberPath: "High", lowMemberPath: "Low", closeMemberPath: "Close", trendLineType: "simpleAverage", trendLineZIndex: 1200 }] ); -
type
- Type:
- enumeration
- Default:
- null
Type of the series.
Members
- area
- Type:string
- Specify the series as Area series.
- bar
- Type:string
- Specify the series as Bar series.
- column
- Type:string
- Specify the series as Column series.
- line
- Type:string
- Specify the series as Line series.
- rangeArea
- Type:string
- Specify the series as Range Area series.
- rangeColumn
- Type:string
- Specify the series as Range Column series.
- splineArea
- Type:string
- Specify the series as Spline Area series.
- spline
- Type:string
- Specify the series as Spline series.
- stepArea
- Type:string
- Specify the series as Step Area series.
- stepLine
- Type:string
- Specify the series as Step Line series.
- waterfall
- Type:string
- Specify the series as Waterfall series.
- financial
- Type:string
- Specify the series as Financial series.
- typicalPriceIndicator
- Type:string
- Specify the series as Typical Price Indicator series.
- polarArea
- Type:string
- Specify the series as Polar Area series.
- polarLine
- Type:string
- Specify the series as Polar Line series.
- polarScatter
- Type:string
- Specify the series as Polar Scatter series.
- radialColumn
- Type:string
- Specify the series as Radial Column series.
- radialLine
- Type:string
- Specify the series as Radial Line series.
- radialPie
- Type:string
- Specify the series as Radial Pie series.
- scatter
- Type:string
- Specify the series as Scatter series.
- scatterLine
- Type:string
- Specify the series as Scatter Line series.
- bubble
- Type:string
- Specify the series as Bubble series.
- absoluteVolumeOscillatorIndicator
- Type:string
- Specify the series as Absolute Volume Oscillator Indicator series.
- averageTrueRangeIndicator
- Type:string
- Specify the series as Average True Range Indicator series.
- accumulationDistributionIndicator
- Type:string
- Specify the series as Accumulation Distribution Indicator series.
- averageDirectionalIndexIndicator
- Type:string
- Specify the series as Average Directional Index Indicator series.
Code Sample
//Initialization $(".selector").igDataChart({ axes: [{ name: "xAxis", type: "numericX" }, { name: "yAxis", type: "numericY" }], series: [{ name: "series1", type: "scatter", xAxis: "xAxis", yAxis: "yAxis", xMemberPath: "Index", yMemberPath: "Value1" }] }); //Get var series = $(".selector").igDataChart("option", "series"); series[0].type; -
unknownValuePlotting
- Type:
- enumeration
- Default:
- dontPlot
Determines how unknown values will be plotted on the chart. Null and Double.NaN are two examples of unknown values.
Members
- linearInterpolate
- Type:string
- Plot the unknown value as the midpoint between surrounding known values using linear interpolation.
- dontPlot
- Type:string
- Do not plot the unknown value on the chart.
Code Sample
//Initialization $(".selector").igDataChart({ axes: [{ name: "xAxis", type: "numericX" }, { name: "yAxis", type: "numericY" }], series: [{ name: "series1", type: "scatter", xAxis: "xAxis", yAxis: "yAxis", xMemberPath: "Index", yMemberPath: "Value1", unknownValuePlotting: "linearInterpolate" }] }); //Get var series = $(".selector").igDataChart("option", "series"); series[0].unknownValuePlotting; //Set $(".selector").igDataChart("option", "series", [{ name: "series1", type: "scatter", xAxis: "xAxis", yAxis: "yAxis", xMemberPath: "Index", yMemberPath: "Value1", unknownValuePlotting: "linearInterpolate" }] ); -
useBruteForce
- Type:
- bool
- Default:
- false
Gets or sets the whether to use use brute force mode.
Code Sample
//Initialization $(".selector").igDataChart({ series: [{ name: "series1", type: "column", useBruteForce: true }] }); //Get var series = $(".selector").igDataChart("option", "series"); series[0].useBruteForce; //Set $(".selector").igDataChart("option", "series", [{ name: "series1", type: "column", useBruteForce: true }] ); -
useCartesianInterpolation
- Type:
- bool
- Default:
- true
Gets or sets whether Cartesian Interpolation should be used rather than Archimedian
spiral based interpolation.Code Sample
//Initialization $(".selector").igDataChart({ axes: [{ name: "xAxis", type: "numericX" }, { name: "yAxis", type: "numericY" }], series: [{ name: "series1", type: "scatter", xAxis: "xAxis", yAxis: "yAxis", xMemberPath: "Index", yMemberPath: "Value1", unknownValuePlotting: "linearInterpolate", useCartesianInterpolation: false }] }); //Get var series = $(".selector").igDataChart("option", "series"); series[0].useCartesianInterpolation; //Set $(".selector").igDataChart("option", "series", [{ name: "series1", type: "scatter", xAxis: "xAxis", yAxis: "yAxis", xMemberPath: "Index", yMemberPath: "Value1", unknownValuePlotting: "linearInterpolate", useCartesianInterpolation: false }] ); -
useHighMarkerFidelity
- Type:
- bool
- Default:
- false
Sets or Gets whether to increase marker fidelity for extreme data shapes that have lots of Y variation over short X intervals.
-
useIndex
- Type:
- bool
- Default:
- false
Sets if the current layer should take up a brush/ordering index in the series collection to derive its color automatically.
Code Sample
//Initialization <script type="text/javascript"> $(function () { $("#chart").igDataChart({ dataSource: data, axes: [{ type: "categoryX", name: "NameAxis", label: "CountryName", }, { type: "numericY", name: "PopulationAxis", }], series: [ { type: "categoryHighlightLayer", name: "categoryHighlightLayer", title: "categoryHighlight", useIndex: "true" } ] }); }); </script> //Get var series = $(".selector").igDataChart("option", "series"); series[0].useIndex; //Set $(".selector").igDataChart("option", "series", [{ type: "categoryHighlightLayer", name: "categoryHighlightLayer", title: "categoryHighlight", useIndex: "true" }] ); -
useInterpolation
- Type:
- bool
- Default:
- false
Gets or sets whether the hover layer should use interpolation to position itself relative the closest values.
Code Sample
//Initialization <script type="text/javascript"> $(function () { $("#chart").igDataChart({ dataSource: data, axes: [{ type: "categoryX", name: "NameAxis", label: "CountryName", }, { type: "numericY", name: "PopulationAxis", }], series: [ { type: "column", name: "2005Population", xAxis: "NameAxis", yAxis: "PopulationAxis", valueMemberPath: "Pop2005" }, { type: "line", name: "1995Population", xAxis: "NameAxis", yAxis: "PopulationAxis", valueMemberPath: "Pop1995" }, { type: "crosshairLayer", name: "crosshairLayer", title: "crosshair", useInterpolation: false, transitionDuration: 500, targetSeries: "2005Population", horizontalLineVisibility: "visible" } ] }); }); </script> //Get var series = $(".selector").igDataChart("option", "series"); series[2].useInterpolation; //Set $(".selector").igDataChart("option", "series", [{ name: "crosshairLayer", title: "crosshair", type: "crosshairLayer", useInterpolation: false }] ); -
useLegend
- Type:
- bool
- Default:
- false
Sets if the current layer should have an entry in the legend of the chart. By default annotation layers are not present in the legend.
Code Sample
//Initialization <script type="text/javascript"> $(function () { $("#chart").igDataChart({ dataSource: data, axes: [{ type: "categoryX", name: "NameAxis", label: "CountryName", }, { type: "numericY", name: "PopulationAxis", }], series: [ { name: "crosshairLayer", title: "crosshair", type: "crosshairLayer", useLegend: "true" } ] }); }); </script> //Get var series = $(".selector").igDataChart("option", "series"); series[0].useLegend; //Set $(".selector").igDataChart("option", "series", [{ name: "crosshairLayer", title: "crosshair", type: "crosshairLayer", useLegend: "true" }] ); -
useSingleShadow
- Type:
- bool
- Default:
- true
Gets or sets whether drop shadow is applied to the whole series visual or to each of the individual shapes forming the series.
Code Sample
// Initialization $(".selector").igDataChart({ axes: [{ name: "xAxis", type: "categoryX", label: "Label" }, { name: "yAxis", type: "numericY" }], series: [{ name: "series1", title: "Sales", type: "column", xAxis: "xAxis", yAxis: "yAxis", valueMemberPath: "Value1", useSingleShadow: false }] }); // Get var series = $(".selector").igDataChart("option", "series"); series[0].useSingleShadow; // Set $(".selector").igDataChart("series", [{ name: "series1", useSingleShadow: false }] ); -
useSquareCutoffStyle
- Type:
- bool
- Default:
- false
Gets or sets the whether to use squares when halting a render traversal rather than the shape of the coalesced area.
Code Sample
//Initialization $(".selector").igDataChart({ series: [{ name: "series1", type: "column", useSquareCutoffStyle: true }] }); //Get var series = $(".selector").igDataChart("option", "series"); series[0].useSquareCutoffStyle; //Set $(".selector").igDataChart("option", "series", [{ name: "series1", type: "column", useSquareCutoffStyle: true }] ); -
valueAxis
- Type:
- string
- Default:
- null
Gets the effective value axis for the current series object.
Code Sample
//Initialization $(".selector").igDataChart({ axes: [{ name: "angleAxis", type: "categoryAngle", label: "Label" }, { name: "radiusAxis", type: "numericRadius" }], series: [{ name: "series1", title: 'Budget', type: "radialLine", angleAxis: "angleAxis", valueAxis: "radiusAxis", valueMemberPath: "Budget" }] }); //Get var series = $(".selector").igDataChart("option", "series"); series[0].valueAxis; //Set $(".selector").igDataChart("option", "series", [{ name: "series1", title: 'Budget', type: "radialLine", angleAxis: "angleAxis", valueAxis: "radiusAxis", valueMemberPath: "Budget" }] ); -
valueMemberPath
- Type:
- string
- Default:
- null
Gets or sets the item path that provides the values for the current series.
Code Sample
//Initialization $(".selector").igDataChart({ axes: [{ name: "angleAxis", type: "categoryAngle", label: "Label" }, { name: "radiusAxis", type: "numericRadius" }], series: [{ name: "series1", title: 'Budget', type: "radialLine", angleAxis: "angleAxis", valueAxis: "radiusAxis", valueMemberPath: "Budget" }] }); //Get var series = $(".selector").igDataChart("option", "series"); series[0].valueMemberPath; //Set $(".selector").igDataChart("option", "series", [{ name: "series1", title: 'Budget', type: "radialLine", angleAxis: "angleAxis", valueAxis: "radiusAxis", valueMemberPath: "Budget" }] ); -
verticalLineVisibility
- Type:
- bool
- Default:
- visible
Gets or sets whether the vertical crosshair portion of the layer should be visible.
Code Sample
//Initialization <script type="text/javascript"> $(function () { $("#chart").igDataChart({ dataSource: data, axes: [{ type: "categoryX", name: "NameAxis", label: "CountryName", }, { type: "numericY", name: "PopulationAxis", }], series: [ { type: "column", name: "2005Population", xAxis: "NameAxis", yAxis: "PopulationAxis", valueMemberPath: "Pop2005" }, { type: "line", name: "1995Population", xAxis: "NameAxis", yAxis: "PopulationAxis", valueMemberPath: "Pop1995" }, { type: "crosshairLayer", name: "crosshairLayer", title: "crosshair", useInterpolation: false, transitionDuration: 500, targetSeries: "2005Population", verticalLineVisibility: "visible" } ] }); }); </script> //Get var series = $(".selector").igDataChart("option", "series"); series[2].verticalLineVisibilty; //Set $(".selector").igDataChart("option", "series", [{ name: "crosshairLayer", title: "crosshair", type: "crosshairLayer", verticalLineVisiblity: "visible" }] ); -
volumeMemberPath
- Type:
- string
- Default:
- null
Gets or sets the volume mapping property for the current series object.
Code Sample
//Initialization $(".selector").igDataChart({ axes: [{ name: "xAxis", type: "categoryX", dataSource: data, label: "Label" }, { name: "yAxis", type: "numericY" }], series: [{ name: "series1", dataSource: data, title: "Price", type: "financial", xAxis: "xAxis", yAxis: "yAxis", openMemberPath: "Open", highMemberPath: "High", lowMemberPath: "Low", closeMemberPath: "Close", volumeMemberPath: "Volume" }] }); //Get var series = $(".selector").igDataChart("option", "series"); series[0].volumeMemberPath; //Set $(".selector").igDataChart("option", "series", [{ name: "series1", dataSource: data, title: "Price", type: "financial", xAxis: "xAxis", yAxis: "yAxis", openMemberPath: "Open", highMemberPath: "High", lowMemberPath: "Low", closeMemberPath: "Close", volumeMemberPath: "Volume" }] ); -
xAxis
- Type:
- string
- Default:
- null
Gets or sets the effective x-axis for the current object.
Code Sample
//Initialization $(".selector").igDataChart({ axes: [{ name: "xAxis", type: "numericX" }, { name: "yAxis", type: "numericY" }], series: [{ name: "series1", type: "scatter", xAxis: "xAxis", yAxis: "yAxis", xMemberPath: "Index", yMemberPath: "Value1" }] }); //Get var series = $(".selector").igDataChart("option", "series"); series[0].xAxis; //Set $(".selector").igDataChart("option", "series", [{ name: "series1", type: "scatter", xAxis: "xAxis", yAxis: "yAxis", xMemberPath: "Index", yMemberPath: "Value1" }] ); -
xMemberPath
- Type:
- string
- Default:
- null
Gets or sets the value mapping property for the current series object.
Code Sample
//Initialization $(".selector").igDataChart({ axes: [{ name: "xAxis", type: "numericX" }, { name: "yAxis", type: "numericY" }], series: [{ name: "series1", type: "scatter", xAxis: "xAxis", yAxis: "yAxis", xMemberPath: "Index", yMemberPath: "Value1" }] }); //Get var series = $(".selector").igDataChart("option", "series"); series[0].xMemberPath; //Set $(".selector").igDataChart("option", "series", [{ name: "series1", type: "scatter", xAxis: "xAxis", yAxis: "yAxis", xMemberPath: "Index", yMemberPath: "Value1" }] ); -
yAxis
- Type:
- string
- Default:
- null
Gets or sets the effective y-axis for the current object.
Code Sample
//Initialization $(".selector").igDataChart({ axes: [{ name: "xAxis", type: "numericX" }, { name: "yAxis", type: "numericY" }], series: [{ name: "series1", type: "scatter", xAxis: "xAxis", yAxis: "yAxis", xMemberPath: "Index", yMemberPath: "Value1" }] }); //Get var series = $(".selector").igDataChart("option", "series"); series[0].yAxis; //Set $(".selector").igDataChart("option", "series", [{ name: "series1", type: "scatter", xAxis: "xAxis", yAxis: "yAxis", xMemberPath: "Index", yMemberPath: "Value1" }] ); -
yMemberPath
- Type:
- string
- Default:
- null
Gets or sets the value mapping property for the current series object.
Code Sample
//Initialization $(".selector").igDataChart({ axes: [{ name: "xAxis", type: "numericX" }, { name: "yAxis", type: "numericY" }], series: [{ name: "series1", type: "scatter", xAxis: "xAxis", yAxis: "yAxis", xMemberPath: "Index", yMemberPath: "Value1" }] }); //Get var series = $(".selector").igDataChart("option", "series"); series[0].yMemberPath; //Set $(".selector").igDataChart("option", "series", [{ name: "series1", type: "scatter", xAxis: "xAxis", yAxis: "yAxis", xMemberPath: "Index", yMemberPath: "Value1" }] );
-
size
- Type:
- object
- Default:
- null
To set both dimensions of the chart simultaneously an object with a width and height property can be provided.
Code Sample
//Initialize $(".selector").igDataChart({ size: { width: 450, height: 450 } }); //Get var size = $(".selector").igDataChart("option", "size"); //Set var size = $(".selector").igDataChart("option", "size", { width: 450, height: 450 }); -
squareMarkerTemplate
- Type:
- object
- Default:
- null
Gets or sets the template to use for square markers on the chart.
Defines the marker template used for
series with a marker type of square.
The provided object should have properties called render and optionally measure. See definition for option: legendItemBadgeTemplate.Code Sample
//Initialize $(".selector").igDataChart({ squareMarkerTemplate: { measure: function(measureInfo) { measureInfo.context; // either a DOM element or a CanvasContext2D depending on the particular template scenario measureInfo.width; // if value is present, specifies the available width, user may set to desired width for content measureInfo.height; // if value is present, specifies the available height, user may set to desired height for content measureInfo.isConstant; // user should set to true if desired with and height will always be the same for this template measureInfo.data; // if present, represents the contextual data for this template] }, render: function (renderInfo) { renderInfo.context; // either a DOM element or a CanvasContext2D depending on the particular template scenario renderInfo.xPosition; // if present, specifies the x position at which to render the content renderInfo.yPosition; // if present, specifies the y position at which to render the content renderInfo.availableWidth; // if present, specifies the available width in which to render the content renderInfo.availableHeight; // if present, specifies the available height in which to render the content renderInfo.data; // if present, specifies the data that is in context for this content renderInfo.isHitTestRender; // if true, indicates that this is a special render pass for hit testing, in which case the brushes from the data should be used } } }); -
subtitle
- Type:
- string
- Default:
- null
The subtitle to display for the component.
Code Sample
// Initialization $(".selector").igDataChart({ title: "Energy Use Per Country", titleTextColor: "red", titleTextStyle: "24pt Verdona", subtitle:"Results over a two year period", subtitleTextColor: "blue", subtitleTextStyle: "16pt Verdona" }); //Get var subtitleValue = $(".selector").igDataChart("option", "subtitle"); //Set $(".selector").igDataChart("option", "subtitle", "Results over a two year period"); -
subtitleBottomMargin
- Type:
- number
- Default:
- 0
The bottom margin to use for the subtitle.
Code Sample
// Initialization $(".selector").igDataChart({ title: "Energy Use Per Country", titleTextColor: "red", titleTextStyle: "24pt Verdona", subtitle:"Results over a two year period", subtitleTextColor: "blue", subtitleTextStyle: "16pt Verdona", subtitleBottomMargin: 10 }); //Get var subtitleBottomMarginValue = $(".selector").igDataChart("option", "subtitleBottomMargin"); //Set $(".selector").igDataChart("option", "subtitleBottomMargin", 10); -
subtitleHorizontalAlignment
- Type:
- enumeration
- Default:
- center
the horizontal alignment to use for the subtitle.
Members
- left
- Type:string
- left aligns the subtitle.
- center
- Type:string
- center aligns the subtitle.
- right
- Type:string
- right aligns the subtitle.
Code Sample
// Initialization $(".selector").igDataChart({ title: "Energy Use Per Country", titleTextColor: "red", titleTextStyle: "24pt Verdona", subtitle:"Results over a two year period", subtitleTextColor: "blue", subtitleTextStyle: "16pt Verdona", subtitleHorizontalAlignment: "center" }); //Get var subtitleHorizontalAlignmentValue = $(".selector").igDataChart("option", "subtitleHorizontalAlignment"); //Set $(".selector").igDataChart("option", "subtitleHorizontalAlignment", "center"); -
subtitleLeftMargin
- Type:
- number
- Default:
- 0
The left margin to use for the subtitle.
Code Sample
// Initialization $(".selector").igDataChart({ title: "Energy Use Per Country", titleTextColor: "red", titleTextStyle: "24pt Verdona", subtitle:"Results over a two year period", subtitleTextColor: "blue", subtitleTextStyle: "16pt Verdona", subtitleLeftMargin: 10 }); //Get var subtitleLeftMarginValue = $(".selector").igDataChart("option", "subtitleLeftMargin"); //Set $(".selector").igDataChart("option", "subtitleLeftMargin", 10); -
subtitleRightMargin
- Type:
- number
- Default:
- 0
The right margin to use for the subtitle.
Code Sample
// Initialization $(".selector").igDataChart({ title: "Energy Use Per Country", titleTextColor: "red", titleTextStyle: "24pt Verdona", subtitle:"Results over a two year period", subtitleTextColor: "blue", subtitleTextStyle: "16pt Verdona", subtitleRightMargin: 10 }); //Get var subtitleRightMarginValue = $(".selector").igDataChart("option", "subtitleRightMargin"); //Set $(".selector").igDataChart("option", "subtitleRightMargin", 10); -
subtitleTextColor
- Type:
- object
- Default:
- black
The color to use for the subtitle.
Code Sample
// Initialization $(".selector").igDataChart({ title: "Energy Use Per Country", titleTextColor: "red", titleTextStyle: "24pt Verdona", subtitle:"Results over a two year period", subtitleTextColor: "blue", subtitleTextStyle: "16pt Verdona", subtitleLeftMargin: 10 }); //Get var subtitleTextColorValue = $(".selector").igDataChart("option", "subtitleTextColor"); //Set $(".selector").igDataChart("option", "subtitleTextColor", "blue"); -
subtitleTextStyle
- Type:
- string
- Default:
- null
The css font property to use for the title.
Code Sample
// Initialization $(".selector").igDataChart({ title: "Energy Use Per Country", titleTextColor: "red", titleTextStyle: "24pt Verdona", subtitle:"Results over a two year period", subtitleTextColor: "blue", subtitleTextStyle: "16pt Verdona", subtitleLeftMargin: 10 }); //Get var subtitleTextStyleValue = $(".selector").igDataChart("option", "subtitleTextStyle"); //Set $(".selector").igDataChart("option", "subtitleTextStyle", "16pt Verdona"); -
subtitleTopMargin
- Type:
- number
- Default:
- 0
The top margin to use for the subtitle.
Code Sample
// Initialization $(".selector").igDataChart({ title: "Energy Use Per Country", titleTextColor: "red", titleTextStyle: "24pt Verdona", subtitle:"Results over a two year period", subtitleTextColor: "blue", subtitleTextStyle: "16pt Verdona", subtitleTopMargin: 10 }); //Get var subtitleTopMarginValue = $(".selector").igDataChart("option", "subtitleTopMargin"); //Set $(".selector").igDataChart("option", "subtitleTopMargin", 10); -
syncChannel
- Type:
- string
- Default:
- null
The channel name to use to sync this chart with other charts.
Code Sample
//Initialize $(".selector").igDataChart({ syncChannel: "syncCharts" }); //Get var syncChannel = $(".selector").igDataChart("option", "syncChannel"); //Set var syncChannel = $(".selector").igDataChart("option", "syncChannel", "syncCharts"); -
synchronizeVertically
- Type:
- bool
- Default:
- true
Whether the chart should be synchronized vertically.
Code Sample
// Initialization $(".selector").igDataChart({ synchronizeVertically: false }); // Get var opValue = $(".selector").igDataChart("option", "synchronizeVertically"); // Set $(".selector").igDataChart("option", "synchronizeVertically", false); -
syncrhonizeHorizontally
- Type:
- bool
- Default:
- false
Whether the chart should be synchronized horizontally.
-
tetragramMarkerTemplate
- Type:
- object
- Default:
- null
Gets or sets the template to use for tetragram markers on the chart.
Defines the marker template used for
series with a marker type of tetragram.
The provided object should have properties called render and optionally measure. See definition for option: legendItemBadgeTemplate.Code Sample
//Initialize $(".selector").igDataChart({ tetragramMarkerTemplate: { measure: function(measureInfo) { measureInfo.context; // either a DOM element or a CanvasContext2D depending on the particular template scenario measureInfo.width; // if value is present, specifies the available width, user may set to desired width for content measureInfo.height; // if value is present, specifies the available height, user may set to desired height for content measureInfo.isConstant; // user should set to true if desired with and height will always be the same for this template measureInfo.data; // if present, represents the contextual data for this template] }, render: function (renderInfo) { renderInfo.context; // either a DOM element or a CanvasContext2D depending on the particular template scenario renderInfo.xPosition; // if present, specifies the x position at which to render the content renderInfo.yPosition; // if present, specifies the y position at which to render the content renderInfo.availableWidth; // if present, specifies the available width in which to render the content renderInfo.availableHeight; // if present, specifies the available height in which to render the content renderInfo.data; // if present, specifies the data that is in context for this content renderInfo.isHitTestRender; // if true, indicates that this is a special render pass for hit testing, in which case the brushes from the data should be used } } }); -
theme
- Type:
- string
- Default:
- "c"
The swatch used to style this widget.
Code Sample
//Initialize $(".selector").igDataChart({ theme: "metro" }); //Get var theme = $(".selector").igDataChart("option", "theme"); -
title
- Type:
- string
- Default:
- null
The title to display for the component.
Code Sample
// Initialization $(".selector").igDataChart({ title: "Energy Use Per Country", titleTextColor: "red", titleTextStyle: "24pt Verdona" }); //Get var titleValue = $(".selector").igDataChart("option", "title"); //Set $(".selector").igDataChart("option", "title", "Energy Use Per Country"); -
titleBottomMargin
- Type:
- number
- Default:
- 0
The bottom margin to use for the title.
Code Sample
// Initialization $(".selector").igDataChart({ title: "Energy Use Per Country", titleTextColor: "red", titleTextStyle: "24pt Verdona", titleBottomMargin: 10 }); //Get var titleBottomMarginValue = $(".selector").igDataChart("option", "titleBottomMargin"); //Set $(".selector").igDataChart("option", "titleBottomMargin", 10); -
titleHorizontalAlignment
- Type:
- enumeration
- Default:
- center
the horizontal alignment to use for the title.
Members
- left
- Type:string
- left aligns the title.
- center
- Type:string
- center aligns the title.
- right
- Type:string
- right aligns the title.
Code Sample
// Initialization $(".selector").igDataChart({ title: "Energy Use Per Country", titleTextColor: "red", titleTextStyle: "24pt Verdona", titleHorizontalAlignment: "center" }); //Get var titleHorizontalAlignmentValue = $(".selector").igDataChart("option", "titleHorizontalAlignment"); //Set $(".selector").igDataChart("option", "titleHorizontalAlignment", "center"); -
titleLeftMargin
- Type:
- number
- Default:
- 0
The left margin to use for the title.
Code Sample
// Initialization $(".selector").igDataChart({ title: "Energy Use Per Country", titleTextColor: "red", titleTextStyle: "24pt Verdona", titleLeftMargin: 10 }); //Get var titleLeftMarginValue = $(".selector").igDataChart("option", "titleLeftMargin"); //Set $(".selector").igDataChart("option", "titleLeftMargin", 10); -
titleRightMargin
- Type:
- number
- Default:
- 0
The right margin to use for the title.
Code Sample
// Initialization $(".selector").igDataChart({ title: "Energy Use Per Country", titleTextColor: "red", titleTextStyle: "24pt Verdona", titleRightMargin: 10 }); //Get var titleRightMarginValue = $(".selector").igDataChart("option", "titleRightMargin"); //Set $(".selector").igDataChart("option", "titleRightMargin", 10); -
titleTextColor
- Type:
- object
- Default:
- black
The color to use for the title.
Code Sample
// Initialization $(".selector").igDataChart({ title: "Energy Use Per Country", titleTextColor: "red", titleTextStyle: "24pt Verdona", titleBottomMargin: 10 }); //Get var titleTextColorValue = $(".selector").igDataChart("option", "titleTextColor"); //Set $(".selector").igDataChart("option", "titleTextColor", "red"); -
titleTextStyle
- Type:
- string
- Default:
- null
The css font property to use for the title.
Code Sample
// Initialization $(".selector").igDataChart({ title: "Energy Use Per Country", titleTextColor: "red", titleTextStyle: "24pt Verdona", titleBottomMargin: 10 }); //Get var titleTextStyleValue = $(".selector").igDataChart("option", "titleTextStyle"); //Set $(".selector").igDataChart("option", "titleTextStyle", "24pt Verdona"); -
titleTopMargin
- Type:
- number
- Default:
- 0
The top margin to use for the title.
Code Sample
// Initialization $(".selector").igDataChart({ title: "Energy Use Per Country", titleTextColor: "red", titleTextStyle: "24pt Verdona", titleTopMargin: 10 }); //Get var titleTopMarginValue = $(".selector").igDataChart("option", "titleTopMargin"); //Set $(".selector").igDataChart("option", "titleTopMargin", 10); -
topMargin
- Type:
- number
- Default:
- 0
Sets or gets the top margin to use around the chart content in the canvas.
Code Sample
//Initialize $(".selector").igDataChart({ topMargin : 20 }); //Get var margin = $(".selector").igDataChart("option", "topMargin"); //Set $(".selector").igDataChart("option", "topMargin", 20); -
triangleMarkerTemplate
- Type:
- object
- Default:
- null
Gets or sets the template to use for triangle markers on the chart.
Defines the marker template used for
series with a marker type of triangle.
The provided object should have properties called render and optionally measure. See definition for option: legendItemBadgeTemplate.Code Sample
//Initialize $(".selector").igDataChart({ triangleMarkerTemplate: { measure: function(measureInfo) { measureInfo.context; // either a DOM element or a CanvasContext2D depending on the particular template scenario measureInfo.width; // if value is present, specifies the available width, user may set to desired width for content measureInfo.height; // if value is present, specifies the available height, user may set to desired height for content measureInfo.isConstant; // user should set to true if desired with and height will always be the same for this template measureInfo.data; // if present, represents the contextual data for this template] }, render: function (renderInfo) { renderInfo.context; // either a DOM element or a CanvasContext2D depending on the particular template scenario renderInfo.xPosition; // if present, specifies the x position at which to render the content renderInfo.yPosition; // if present, specifies the y position at which to render the content renderInfo.availableWidth; // if present, specifies the available width in which to render the content renderInfo.availableHeight; // if present, specifies the available height in which to render the content renderInfo.data; // if present, specifies the data that is in context for this content renderInfo.isHitTestRender; // if true, indicates that this is a special render pass for hit testing, in which case the brushes from the data should be used } } }); -
useTiledZooming
- Type:
- bool
- Default:
- false
Sets whether the series viewer should use cached tiles during zooms rather than the default live content.
-
verticalZoomable
- Type:
- bool
- Default:
- false
Gets or sets the current Chart's vertical zoomability.
Code Sample
// Initialization $(".selector").igDataChart({ verticalZoomable: true }); // Get var opValue = $(".selector").igDataChart("option", "verticalZoomable"); // Set $(".selector").igDataChart("option", "verticalZoomable", true); -
width
- Type:
- enumeration
- Default:
- null
The width of the chart. It can be set as a number in pixels, string (px) or percentage (%).
Code Sample
// Initialization $(".selector").igDataChart({ width: "700px" }); // Get var width = $(".selector").igDataChart("option", "width"); // Set $(".selector").igDataChart("option", "width", "700px"); -
windowPositionHorizontal
- Type:
- number
- Default:
- 0
A number between 0 and 1 determining the position of the horizontal scroll.
This property is effectively a shortcut to the X position of the WindowRect property.Code Sample
// Initialization $(".selector").igDataChart({ windowPositionHorizontal: 0.25 }); // Get var opValue = $(".selector").igDataChart("option", "windowPositionHorizontal"); // Set $(".selector").igDataChart("option", "windowPositionHorizontal", 0.25); -
windowPositionVertical
- Type:
- number
- Default:
- 0
A number between 0 and 1 determining the position of the vertical scroll.
This property is effectively a shortcut to the Y position of the WindowRect property.Code Sample
// Initialization $(".selector").igDataChart({ windowPositionVertical: 0.25 }); // Get var opValue = $(".selector").igDataChart("option", "windowPositionVertical"); // Set $(".selector").igDataChart("option", "windowPositionVertical", 0.25); -
windowRect
- Type:
- object
- Default:
- null
A rectangle representing the portion of the chart currently in view.
A rectangle at X=0, Y=0 with a Height and Width of 1 implies the entire plotting area is in view. A Height and Width of .5 would imply that the view is halfway zoomed in.
The provided object should have numeric properties called left, top, width and height.Code Sample
// Initialization $(".selector").igDataChart({ windowRect: { left: 0, top: 0, width: 0.5, height: 0.5 } }); // Get var opValue = $(".selector").igDataChart("option", "windowRect"); // Set $(".selector").igDataChart("option", "windowRect", { left: 0, top: 0, width: 0.5, height: 0.5 }); -
windowRectMinWidth
- Type:
- number
- Default:
- 0
Sets or gets the minimum width that the window rect is allowed to reach before being clamped.
Decrease this value if you want to allow for further zooming into the viewer.
If this value is lowered too much it can cause graphical corruption due to floating point arithmetic inaccuracy.Code Sample
// Initialization $(".selector").igDataChart({ windowRectMinWidth: 0.5 }); // Get var windowRectMinWidth = $(".selector").igDataChart("option", "windowRectMinWidth"); // Set $(".selector").igDataChart("option", "windowRectMinWidth", 0.5); -
windowResponse
- Type:
- enumeration
- Default:
- null
The response to user panning and zooming: whether to update the view immediately while the user action is happening, or to defer the update to after the user action is complete. The user action will be an action such as a mouse drag which causes panning and/or zooming to occur.
Members
- deferred
- Type:string
- Defer the view update until after the user action is complete.
- immediate
- Type:string
- Update the view immediately while the user action is happening.
Code Sample
// Initialization $(".selector").igDataChart({ windowResponse: "immediate" }); // Get var opValue = $(".selector").igDataChart("option", "windowResponse"); // Set $(".selector").igDataChart("option", "windowResponse", "immediate"); -
windowScaleHorizontal
- Type:
- number
- Default:
- 1
A number between 0 and 1 determining the scale of the horizontal zoom.
This property is effectively a shortcut to the Width of the WindowRect property.Code Sample
// Initialization $(".selector").igDataChart({ windowScaleHorizontal: 0.5 }); // Get var opValue = $(".selector").igDataChart("option", "windowScaleHorizontal"); // Set $(".selector").igDataChart("option", "windowScaleHorizontal", 0.5); -
windowScaleVertical
- Type:
- number
- Default:
- 1
A number between 0 and 1 determining the scale of the vertical zoom.
This property is effectively a shortcut to the Height of the WindowRect property.Code Sample
// Initialization $(".selector").igDataChart({ windowScaleVertical: 0.5 }); // Get var opValue = $(".selector").igDataChart("option", "windowScaleVertical"); // Set $(".selector").igDataChart("option", "windowScaleVertical", 0.5); -
zoomTileCacheSize
- Type:
- number
- Default:
- 30
Sets the maximum number of zoom tiles that the series viewer should cache while in tiled zooming mode.
For more information on how to interact with the Ignite UI controls' events, refer to
Using Events in Ignite UI.
-
assigningCategoryMarkerStyle
- Cancellable:
- false
Event fired to allow you to override the style of markers for the items in a category or financial series. Only fires if you set allowCustomCategoryMarkerStyle to true for a series.
Function takes arguments evt and ui.
Use ui.chart to get reference to chart object.
Use ui.series to get reference to current series object.
Use ui.startIndex to get the start index for the current items.
Use ui.endIndex to get the end index for the current items.
Use ui.hasDateRange to tell if you should use the startDate and endDate to know the current items instead of startIndex/endIndex.
Use ui.startDate if ui.hasDateRange is true.
Use ui.endDate if ui.hasDateRange is true.
Use ui.getItems to get all the items associated with the event (only if necessary).
Use ui.fill to get or set the fill to use for the current item.
Use ui.stroke to get or set the stroke to use for the current item.
Use ui.opacity to get or set the opacity to use for the current item.
Use ui.highlightingHandled to set if the default highlighting behavior should not run, given that you are handling it in this event.
Use ui.maxAllSeriesHighlightingProgress to get the maximum highlighted progress across all series.
Use ui.sumAllSeriesHighlightingProgress to get the sum of highlighting progtess across all series.
Use ui.highlightingInfo.progress to tell what the highlighting progress is for the current item, if highlightingInfo is not null.
Use ui.highlightingInfo.state to tell whether the current item is currently highlighting in or out, is static, if highlightingInfo is not null.Code Sample
// Delegate $(document).delegate(".selector", "igdatachartassigningCategoryMarkerStyle", function (evt, ui) { // Overrides the default strokeThickness property of the marker. ui.strokeThickness; // Overrides the default strokeDashArray property of the marker. ui.strokeDashArray; // Overrides the default strokeDashCap property of the marker. ui.strokeDashCap; // Overrides the default radiusX property. ui.radiusX; // Overrides the default radiusY property. ui.radiusY; }); // Initialize $(".selector").igDataChart({ assigningCategoryMarkerStyle: function (evt, ui) { } }); -
assigningCategoryStyle
- Cancellable:
- false
Event fired to allow you to override the style of items in a category or financial series. Only fires if you set allowCustomCategoryStyle to true for a series.
Function takes arguments evt and ui.
Use ui.chart to get reference to chart object.
Use ui.series to get reference to current series object.
Use ui.startIndex to get the start index for the current items.
Use ui.endIndex to get the end index for the current items.
Use ui.hasDateRange to tell if you should use the startDate and endDate to know the current items instead of startIndex/endIndex.
Use ui.startDate if ui.hasDateRange is true.
Use ui.endDate if ui.hasDateRange is true.
Use ui.getItems to get all the items associated with the event (only if necessary).
Use ui.fill to get or set the fill to use for the current item.
Use ui.stroke to get or set the stroke to use for the current item.
Use ui.opacity to get or set the opacity to use for the current item.
Use ui.highlightingHandled to set if the default highlighting behavior should not run, given that you are handling it in this event.
Use ui.maxAllSeriesHighlightingProgress to get the maximum highlighted progress across all series.
Use ui.sumAllSeriesHighlightingProgress to get the sum of highlighting progtess across all series.
Use ui.highlightingInfo.progress to tell what the highlighting progress is for the current item, if highlightingInfo is not null.
Use ui.highlightingInfo.state to tell whether the current item is currently highlighting in or out, is static, if highlightingInfo is not null.Code Sample
// Delegate $(document).delegate(".selector", "igdatachartassigningCategoryStyle", function (evt, ui) { // Specifies the start index of the range of data that is currently being highlighted. ui.startIndex; // Specifies the end index of the range of the data that is currently being highlighted. ui.endIndex; // Specifies the start date of the range of data that is currently being highlighted. ui.startDate; // Specifies the end date of the range of data that is currently being highlighted. ui.endDate; // Specifies the actual items from the data source being highlighted. However if there was a lot of data and this was called every time the event was fired, it will negatively impact the performance ui.getItems; // Overrides the default Fill property of the series. However, this property only takes affect if the Fill property only affects that particular series. ui.fill; // Overrides the default Stroke property of the series. ui.stroke; // Overrides the default the Opacity property of the series. ui.opacity; // This is used to determine the styling of the highlighted series. ui.highlightingInfo; // Specifies the progress state of the highlighting of the series. Value from 0 to 1. ui.maxAllSeriesHighlightingProgress; // Specifies the progress state of the highlighting of the series. Value from 0 to 1. ui.sumAllSeriesHighlightingProgress; // When set to True the default highlighting doesn’t apply. ui.highlightingHandled; // Determines if you should use the startDate and endDate to know the current items instead of startIndex/endIndex. ui.hasDataRange; }); // Initialize $(".selector").igDataChart({ assigningCategoryStyle: function (evt, ui) { } }); -
axisRangeChanged
- Cancellable:
- false
Event fired when the range of and axis on the chart changes.
Function takes arguments evt and ui.
Use ui.axis to get reference to current chart axis object.
Use ui.chart to get reference to chart object.
Use ui.newMaximumValue to get new maximum value.
Use ui.newMinimumValue to get new minimum value.
Use ui.oldMaximumValue to get old maximum value.
Use ui.oldMinimumValue to get old minimum value.Code Sample
// Delegate $(document).delegate(".selector", "igdatachartaxisrangechanged", function (evt, ui) { // Get reference to current chart axis object. ui.axis; // Get reference to chart object. ui.chart; // Get the new maximum value. ui.newMaximumValue; // Get the new minimum value. ui.newMinimumValue; // Get the old maximum value. ui.oldMaximumValue; // Get the old minimum value. ui.oldMinimumValue; }); // Initialize $(".selector").igDataChart({ axisRangeChanged: function (evt, ui) { } }); -
browserNotSupported
- Cancellable:
- false
Event fired when the control is displayed on a non HTML5 compliant browser.
Code Sample
// Delegate $(document).delegate(".selector", "igdatachartbrowsernotsupported", function (evt, ui) { }); // Initialize $(".selector").igDataChart({ browserNotSupported: function (evt, ui) { } }); -
gridAreaRectChanged
- Cancellable:
- false
Occurs just after the current Chart's grid area rectangle is changed.
The grid area may change as the result of the Chart being resized, or
of an axis being added or changing size, possibly in another Chart.
Function takes arguments evt and ui.
Use ui.chart to get reference to chart object.
Use ui.newHeight to get new height value.
Use ui.newLeft to get new left value.
Use ui.newTop to get new top value.
Use ui.newWidth to get new top value.
Use ui.oldHeight to get old height value.
Use ui.oldLeft to get old left value.
Use ui.oldTop to get old top value.
Use ui.oldWidth to get old top value.Code Sample
// Delegate $(document).delegate(".selector", "igdatachartgridarearectchanged", function (evt, ui) { // Get reference to chart object. ui.chart; // Get new height value. ui.newHeight; // Get new left value. ui.newLeft; // Get new top value. ui.newTop; // Get new top value. ui.newWidth; // Get old height value. ui.oldHeight; // Get old left value. ui.oldLeft; // Get old top value. ui.oldTop; // Get old top value. ui.oldWidth; }); // Initialize $(".selector").igDataChart({ gridAreaRectChanged: function (evt, ui) { } }); -
progressiveLoadStatusChanged
- Cancellable:
- false
Event fired when the progressive loading state of the series has changed.
Function takes arguments evt and ui.
Use ui.chart to get reference to chart object.
Use ui.series to get reference to current series object.
Use ui.currentStatus to get current status.Code Sample
// Delegate $(document).delegate(".selector", "igdatachartprogressiveloadstatuschanged", function (evt, ui) { // Get reference to chart object. ui.chart; // Get the series object. ui.series; // Get the current load status. ui.currentStatus; }); // Initialize $(".selector").igDataChart({ progressiveLoadStatusChanged: function (evt, ui) { } }); -
refreshCompleted
- Cancellable:
- false
Raised when the chart's processing for an update has completed.
Function takes arguments evt and ui.
Use ui.chart to get reference to chart object.Code Sample
// Delegate $(document).delegate(".selector", "igdatachartrefreshcompleted", function (evt, ui) { // Get reference to chart object. ui.chart; }); // Initialize $(".selector").igDataChart({ refreshCompleted: function (evt, ui) { } }); -
seriesCursorMouseMove
- Cancellable:
- false
Occurs when the cursors are moved over a series in this chart.
Function takes arguments evt and ui.
Use ui.item to get reference to current series item object.
Use ui.chart to get reference to chart object.
Use ui.series to get reference to current series object.
Use ui.actualItemBrush to get item brush.
Use ui.actualSeriesBrush to get series brush.
Use ui.positionX to get mouse X position.
Use ui.positionY to get mouse Y position.Code Sample
// Delegate $(document).delegate(".selector", "igdatachartseriescursormousemove", function (evt, ui) { // Get reference to current series item object. ui.item; // Get reference to chart object. ui.chart; // Get reference to current series object. ui.series; // Get item brush. ui.actualItemBrush; // Get series brush. ui.actualSeriesBrush; // Get mouse X position. ui.positionX; // Get mouse Y position. ui.positionY; }); // Initialize $(".selector").igDataChart({ seriesCursorMouseMove: function (evt, ui) { } }); -
seriesMouseEnter
- Cancellable:
- false
Occurs when the left mouse pointer enters an element of this chart.
Function takes arguments evt and ui.
Use ui.item to get reference to current series item object.
Use ui.chart to get reference to chart object.
Use ui.series to get reference to current series object.
Use ui.actualItemBrush to get item brush.
Use ui.actualSeriesBrush to get series brush.
Use ui.positionX to get mouse X position.
Use ui.positionY to get mouse Y position.Code Sample
// Delegate $(document).delegate(".selector", "igdatachartseriesmouseenter", function (evt, ui) { // Get reference to current series item object. ui.item; // Get reference to chart object. ui.chart; // Get reference to current series object. ui.series; // Get item brush. ui.actualItemBrush; // Get series brush. ui.actualSeriesBrush; // Get mouse X position. ui.positionX; // Get mouse Y position. ui.positionY; }); // Initialize $(".selector").igDataChart({ seriesMouseEnter: function (evt, ui) { } }); -
seriesMouseLeave
- Cancellable:
- false
Occurs when the left mouse pointer leaves an element of this chart.
Function takes arguments evt and ui.
Use ui.item to get reference to current series item object.
Use ui.chart to get reference to chart object.
Use ui.series to get reference to current series object.
Use ui.actualItemBrush to get item brush.
Use ui.actualSeriesBrush to get series brush.
Use ui.positionX to get mouse X position.
Use ui.positionY to get mouse Y position.Code Sample
// Delegate $(document).delegate(".selector", "igdatachartseriesmouseleave", function (evt, ui) { // Get reference to current series item object. ui.item; // Get reference to chart object. ui.chart; // Get reference to current series object. ui.series; // Get item brush. ui.actualItemBrush; // Get series brush. ui.actualSeriesBrush; // Get mouse X position. ui.positionX; // Get mouse Y position. ui.positionY; }); // Initialize $(".selector").igDataChart({ seriesMouseLeave: function (evt, ui) { } }); -
seriesMouseLeftButtonDown
- Cancellable:
- false
Occurs when the left mouse button is pressed while the mouse pointer is over an element of this chart.
Function takes arguments evt and ui.
Use ui.item to get reference to current series item object.
Use ui.chart to get reference to chart object.
Use ui.series to get reference to current series object.
Use ui.actualItemBrush to get item brush.
Use ui.actualSeriesBrush to get series brush.
Use ui.positionX to get mouse X position.
Use ui.positionY to get mouse Y position.Code Sample
// Delegate $(document).delegate(".selector", "igdatachartseriesmouseleftbuttondown", function (evt, ui) { // Get reference to current series item object. ui.item; // Get reference to chart object. ui.chart; // Get reference to current series object. ui.series; // Get item brush. ui.actualItemBrush; // Get series brush. ui.actualSeriesBrush; // Get mouse X position. ui.positionX; // Get mouse Y position. ui.positionY; }); // Initialize $(".selector").igDataChart({ seriesMouseLeftButtonDown: function (evt, ui) { } }); -
seriesMouseLeftButtonUp
- Cancellable:
- false
Occurs when the left mouse button is released while the mouse pointer is over an element of this chart.
Function takes arguments evt and ui.
Use ui.item to get reference to current series item object.
Use ui.chart to get reference to chart object.
Use ui.series to get reference to current series object.
Use ui.actualItemBrush to get item brush.
Use ui.actualSeriesBrush to get series brush.
Use ui.positionX to get mouse X position.
Use ui.positionY to get mouse Y position.Code Sample
// Delegate $(document).delegate(".selector", "igdatachartseriesmouseleftbuttonup", function (evt, ui) { // Get reference to current series item object. ui.item; // Get reference to chart object. ui.chart; // Get reference to current series object. ui.series; // Get item brush. ui.actualItemBrush; // Get series brush. ui.actualSeriesBrush; // Get mouse X position. ui.positionX; // Get mouse Y position. ui.positionY; }); // Initialize $(".selector").igDataChart({ seriesMouseLeftButtonUp: function (evt, ui) { } }); -
seriesMouseMove
- Cancellable:
- false
Occurs when the left mouse pointer moves while over an element of this chart.
Function takes arguments evt and ui.
Use ui.item to get reference to current series item object.
Use ui.chart to get reference to chart object.
Use ui.series to get reference to current series object.
Use ui.actualItemBrush to get item brush.
Use ui.actualSeriesBrush to get series brush.
Use ui.positionX to get mouse X position.
Use ui.positionY to get mouse Y position.Code Sample
// Delegate $(document).delegate(".selector", "igdatachartseriesmousemove", function (evt, ui) { // Get reference to current series item object. ui.item; // Get reference to chart object. ui.chart; // Get reference to current series object. ui.series; // Get item brush. ui.actualItemBrush; // Get series brush. ui.actualSeriesBrush; // Get mouse X position. ui.positionX; // Get mouse Y position. ui.positionY; }); // Initialize $(".selector").igDataChart({ seriesMouseMove: function (evt, ui) { } }); -
tooltipHidden
- Cancellable:
- false
Event fired after a tooltip is hidden
Function takes arguments evt and ui.
Use ui.element to get reference to tooltip DOM element.
Use ui.item to get reference to current series item object.
Use ui.chart to get reference to chart object.
Use ui.series to get reference to current series object.
Use ui.actualItemBrush to get item brush.
Use ui.actualSeriesBrush to get series brush.Code Sample
// Delegate $(document).delegate(".selector", "igdatacharttooltiphidden", function (evt, ui) { // Get reference to tooltip DOM element. ui.element; // Get reference to current series item object. ui.item; // Get reference to chart object. ui.chart; // Get reference to current series object. ui.series; // Get item brush. ui.actualItemBrush; // Get series brush. ui.actualSeriesBrush; }); // Initialize $(".selector").igDataChart({ tooltipHidden: function (evt, ui) { } }); -
tooltipHiding
- Cancellable:
- true
Event fired when the mouse has left a series and the tooltip is about to hide
Function takes arguments evt and ui.
Use ui.element to get reference to tooltip DOM element.
Use ui.item to get reference to current series item object.
Use ui.chart to get reference to chart object.
Use ui.series to get reference to current series object.
Use ui.actualItemBrush to get item brush.
Use ui.actualSeriesBrush to get series brush.Code Sample
// Delegate $(document).delegate(".selector", "igdatacharttooltiphiding", function (evt, ui) { // Get reference to tooltip DOM element. ui.element; // Get reference to current series item object. ui.item; // Get reference to chart object. ui.chart; // Get reference to current series object. ui.series; // Get item brush. ui.actualItemBrush; // Get series brush. ui.actualSeriesBrush; }); // Initialize $(".selector").igDataChart({ tooltipHiding: function (evt, ui) { } }); -
tooltipShowing
- Cancellable:
- true
Event fired when the mouse has hovered on a series and the tooltip is about to show
Function takes arguments evt and ui.
Use ui.element to get reference to tooltip DOM element.
Use ui.item to get reference to current series item object.
Use ui.chart to get reference to chart object.
Use ui.series to get reference to current series object.
Use ui.actualItemBrush to get item brush.
Use ui.actualSeriesBrush to get series brush.Code Sample
// Delegate $(document).delegate(".selector", "igdatacharttooltipshowing", function (evt, ui) { // Get reference to tooltip DOM element. ui.element; // Get reference to current series item object. ui.item; // Get reference to chart object. ui.chart; // Get reference to current series object. ui.series; // Get item brush. ui.actualItemBrush; // Get series brush. ui.actualSeriesBrush; }); // Initialize $(".selector").igDataChart({ tooltipShowing: function (evt, ui) { } }); -
tooltipShown
- Cancellable:
- false
Event fired after a tooltip is shown
Function takes arguments evt and ui.
Use ui.element to get reference to tooltip DOM element.
Use ui.item to get reference to current series item object.
Use ui.chart to get reference to chart object.
Use ui.series to get reference to current series object.
Use ui.actualItemBrush to get item brush.
Use ui.actualSeriesBrush to get series brush.Code Sample
// Delegate $(document).delegate(".selector", "igdatacharttooltipshown", function (evt, ui) { // Get reference to tooltip DOM element. ui.element; // Get reference to current series item object. ui.item; // Get reference to chart object. ui.chart; // Get reference to current series object. ui.series; // Get item brush. ui.actualItemBrush; // Get series brush. ui.actualSeriesBrush; }); // Initialize $(".selector").igDataChart({ tooltipShown: function (evt, ui) { } }); -
typicalBasedOn
- Cancellable:
- false
Handle this event in order to specify which columns the Typical price calculation is based on.
Function takes arguments evt and ui.
Use ui.chart to get reference to chart object.
Use ui.series to get reference to current series object.
Use ui.count to get the number of positions that should be calculated from the start.
Use ui.position to get the beginning position that should be calculated from.
Use ui.supportingCalculations to get the supporting calculations to use in the calculation.
Use ui.dataSource to get the data to use for the calculation.
Use ui.basedOn to specify which columns changing will invalidate the series and cause it to be recalculated.Code Sample
// Delegate $(document).delegate(".selector", "igdatacharttypicalbasedon", function (evt, ui) { // Get reference to chart object. ui.chart; // Get the series object. ui.series; // Get the the number of positions that should be calculated from the start. ui.count; // Get the beginning position that should be calculated from. ui.position; // Get the supporting calculations to use in the calculation. ui.supportingCalculations; // Get the data to use for the calculation. ui.dataSource; // Specify which columns changing will invalidate the series and cause it to be recalculated. ui.basedOn; }); // Initialize $(".selector").igDataChart({ typicalBasedOn: function (evt, ui) { } }); -
windowRectChanged
- Cancellable:
- false
Occurs just after the current Chart's window rectangle is changed.
Function takes arguments evt and ui.
Use ui.chart to get reference to chart object.
Use ui.newHeight to get new height value.
Use ui.newLeft to get new left value.
Use ui.newTop to get new top value.
Use ui.newWidth to get new top value.
Use ui.oldHeight to get old height value.
Use ui.oldLeft to get old left value.
Use ui.oldTop to get old top value.
Use ui.oldWidth to get old top value.Code Sample
// Delegate $(document).delegate(".selector", "igdatachartwindowrectchanged", function (evt, ui) { // Get reference to chart object. ui.chart; // Get new height value. ui.newHeight; // Get new left value. ui.newLeft; // Get new top value. ui.newTop; // Get new top value. ui.newWidth; // Get old height value. ui.oldHeight; // Get old left value. ui.oldLeft; // Get old top value. ui.oldTop; // Get old top value. ui.oldWidth; }); // Initialize $(".selector").igDataChart({ windowRectChanged: function (evt, ui) { } });
-
addItem
- .igDataChart( "addItem", item:object, targetName:string );
Adds a new item to the data source and notifies the chart.
- item
- Type:object
- The item that we want to add to the data source.
- targetName
- Type:string
- The name of the series or axis bound to the data source. This is required only when the data is bound to series or axis. If the data is bound to dataSource of igDataChart, the second parameter should not be set.
Code Sample
$(".selector").igDataChart("addItem", {"Item1": "Value1", "Item2": 1000, "Item3": 1019.75}, "series1" ); -
clearTileZoomCache
- .igDataChart( "clearTileZoomCache" );
Clears the tile zoom tile cache so that new tiles will be generated. Only applies if the viewer is using a tile based zoom.
-
destroy
- .igDataChart( "destroy" );
Destroys the widget.
Code Sample
$(".selector").igDataChart("destroy"); -
endTiledZoomingIfRunning
- .igDataChart( "endTiledZoomingIfRunning" );
Manually ends a tiled zoom if one is running.
-
exportImage
- .igDataChart( "exportImage", [width:object], [height:object] );
- Return Type:
- object
- Return Type Description:
- Returns a IMG DOM element.
Exports the chart to a PNG image.
- width
- Type:object
- Optional
- The width of the image.
- height
- Type:object
- Optional
- The height of the image.
Code Sample
var pngImage = $(".selector").igDataChart("exportImage", 200, 100); -
exportVisualData
- .igDataChart( "exportVisualData" );
Exports visual data from the chart to aid in unit testing.
Code Sample
var data = $(".selector").igDataChart("exportVisualData"); -
flush
- .igDataChart( "flush" );
Forces any pending deferred work to render on the chart before continuing.
Code Sample
$(".selector").igDataChart("flush"); -
getActualMaximumValue
- .igDataChart( "getActualMaximumValue", targetName:string );
Gets the actual maximum value of the target numeric or date time axis.
- targetName
- Type:string
- The name of the axis from which to get the maximum value.
Code Sample
var maxAxes = $(".selector").igDataChart("getActualMaximumValue", axe); -
getActualMinimumValue
- .igDataChart( "getActualMinimumValue", targetName:string );
Gets the actual minimum value of the target numeric or date time axis.
- targetName
- Type:string
- The name of the axis from which to get the minimum value.
Code Sample
var minAxes = $(".selector").igDataChart("getActualMinimumValue", axis); -
getItem
- .igDataChart( "getItem", targetName:string, worldPoint:object );
- Return Type:
- object
- Return Type Description:
- The item that is the best match.
Gets the item that is the best match for the specified world coordinates.
- targetName
- Type:string
- The name of the series to target.
- worldPoint
- Type:object
- The world position (in the form {x: [number from 0 to 1], y: [number from 0 to 1]} ) that represents a position in the space of the axes.
Code Sample
var item = $(".selector").igDataChart("getItem", series1, {x:0.5, y:0.5}); -
getItemFromSeriesPixel
- .igDataChart( "getItemFromSeriesPixel", targetName:string, seriesPoint:object );
- Return Type:
- object
- Return Type Description:
- The item that is the best match.
Gets the item that is the best match for the specified world coordinates.
- targetName
- Type:string
- The name of the series to target.
- seriesPoint
- Type:object
- The series pixel position (in the form {x: [number], y: [number]} ) that represents a position in the pixel space of the series.
Code Sample
var item = $(".selector").igDataChart("getItemFromSeriesPixel", series1, {x:0.5, y:0.5}); -
getItemIndex
- .igDataChart( "getItemIndex", targetName:string, worldPoint:object );
- Return Type:
- number
- Return Type Description:
- Item index or -1 if no item is assocated with the specified world position.
Gets the item item index associated with the specified world position.
- targetName
- Type:string
- The name of the series to target.
- worldPoint
- Type:object
- The world position (in the form {x: [number from 0 to 1], y: [number from 0 to 1]} ) that represents a position in the space of the axes.
Code Sample
var item = $(".selector").igDataChart("getItemIndex", series1, {x:0.5, y:0.5}); -
getItemIndexFromSeriesPixel
- .igDataChart( "getItemIndexFromSeriesPixel", targetName:string, seriesPoint:object );
- Return Type:
- number
- Return Type Description:
- Item index or -1 if no item is assocated with the specified world position.
Gets the item item index associated with the specified series pixel coordinate.
- targetName
- Type:string
- The name of the series to target.
- seriesPoint
- Type:object
- The world position (in the form {x: [number from 0 to 1], y: [number from 0 to 1]} ) that represents a position in the space of the axes.
Code Sample
var item = $(".selector").igDataChart("getItemIndexFromSeriesPixel", series1, {x:0.5, y:0.5}); -
getItemSpan
- .igDataChart( "getItemSpan", targetName:string );
- Return Type:
- number
- Return Type Description:
- The width of the items for this series within the categories.
For a category plotted series, gets the current width of the items within the categories. This only returns a value if the items have some form of width (e.g. columns, bars, etc.) otherwise 0 is returned.
- targetName
- Type:string
- The name of the series to target.
-
getSeriesCategoryWidth
- .igDataChart( "getSeriesCategoryWidth", targetName:string );
- Return Type:
- number
- Return Type Description:
- The pixel width of the categories.
Gets the category width for a series, if applicable.
- targetName
- Type:string
- The name of the series to target.
Code Sample
var item = $(".selector").igDataChart("getSeriesCategoryWidth", series1); -
getSeriesHighValue
- .igDataChart( "getSeriesHighValue", targetName:string, worldPoint:object, useInterpolation:bool, skipUnknowns:bool );
- Return Type:
- number
- Return Type Description:
- The value of the series at the specified world coordinate, or double.NaN if unavailable.
If possible, will return the best available high value of the series for a given world coordinate.
- targetName
- Type:string
- The name of the series to target.
- worldPoint
- Type:object
- The world position (in the form {x: [number from 0 to 1], y: [number from 0 to 1]} ) that represents a position in the space of the axes.
- useInterpolation
- Type:bool
- If true, interpolation should be used to get in-between values, rather than only the actual values in the data set.
- skipUnknowns
- Type:bool
- If true, unknown values should be skipped.
Code Sample
var item = $(".selector").igDataChart("getSeriesHighValue", series1, {x:0.5, y:0.5}, true, true); -
getSeriesHighValueFromSeriesPixel
- .igDataChart( "getSeriesHighValueFromSeriesPixel", targetName:string, seriesPoint:object, useInterpolation:bool, skipUnknowns:bool );
- Return Type:
- number
- Return Type Description:
- The value of the series at the specified world coordinate, or double.NaN if unavailable.
If possible, will return the best available high value of the series for a given world coordinate.
- targetName
- Type:string
- The name of the series to target.
- seriesPoint
- Type:object
- The series pixel position (in the form {x: [number], y: [number]} ) that represents a position in the pixel space of the series.
- useInterpolation
- Type:bool
- If true, interpolation should be used to get in-between values, rather than only the actual values in the data set.
- skipUnknowns
- Type:bool
- If true, unknown values should be skipped.
Code Sample
var item = $(".selector").igDataChart("getSeriesHighValueFromSeriesPixel", series1, {x:0.5, y:0.5}, true, true); -
getSeriesHighValuePosition
- .igDataChart( "getSeriesHighValuePosition", targetName:string, worldPoint:object, useInterpolation:bool, skipUnknowns:bool );
- Return Type:
- object
- Return Type Description:
- The position of the best available high value for the series in series pixel space.
If possible, will return the best available high value position of the series for a given world coordinate.
- targetName
- Type:string
- The name of the series to target.
- worldPoint
- Type:object
- The world position (in the form {x: [number from 0 to 1], y: [number from 0 to 1]} ) that represents a position in the space of the axes.
- useInterpolation
- Type:bool
- If true, interpolation should be used to get in-between values, rather than only the actual values in the data set.
- skipUnknowns
- Type:bool
- If true, unknown values should be skipped.
Code Sample
var item = $(".selector").igDataChart("getSeriesHighValuePosition", series1, {x:0.5, y:0.5}, true, true); -
getSeriesHighValuePositionFromSeriesPixel
- .igDataChart( "getSeriesHighValuePositionFromSeriesPixel", targetName:string, seriesPoint:object, useInterpolation:bool, skipUnknowns:bool );
- Return Type:
- object
- Return Type Description:
- The position (in the form {x: [number], y: [number]} ) of the best available high value for the series in series pixel space.
If possible, will return the best available high value position of the series for a given world coordinate.
- targetName
- Type:string
- The name of the series to target.
- seriesPoint
- Type:object
- The series pixel position (in the form {x: [number], y: [number]} that represents a position within the pixel space of the series.
- useInterpolation
- Type:bool
- If true, interpolation should be used to get in-between values, rather than only the actual values in the data set.
- skipUnknowns
- Type:bool
- If true, unknown values should be skipped.
Code Sample
var item = $(".selector").igDataChart("getSeriesHighValuePositionFromSeriesPixel", series1, {x:0.5, y:0.5}, true, true); -
getSeriesLowValue
- .igDataChart( "getSeriesLowValue", targetName:string, worldPoint:object, useInterpolation:bool, skipUnknowns:bool );
- Return Type:
- number
- Return Type Description:
- The value of the series at the specified world coordinate, or double.NaN if unavailable.
If possible, will return the best available low value of the series for a given world coordinate.
- targetName
- Type:string
- The name of the series to target.
- worldPoint
- Type:object
- The world position (in the form {x: [number from 0 to 1], y: [number from 0 to 1]} ) that represents a position in the space of the axes.
- useInterpolation
- Type:bool
- If true, interpolation should be used to get in-between values, rather than only the actual values in the data set.
- skipUnknowns
- Type:bool
- If true, unknown values should be skipped.
Code Sample
var item = $(".selector").igDataChart("getSeriesLowValue", series1, {x:0.5, y:0.5}, true, true); -
getSeriesLowValueFromSeriesPixel
- .igDataChart( "getSeriesLowValueFromSeriesPixel", targetName:string, seriesPoint:object, useInterpolation:bool, skipUnknowns:bool );
- Return Type:
- number
- Return Type Description:
- The value of the series at the specified world coordinate, or double.NaN if unavailable.
If possible, will return the best available low value of the series for a given world coordinate.
- targetName
- Type:string
- The name of the series to target.
- seriesPoint
- Type:object
- The series pixel position (in the form {x: [number], y: [number]} ) that represents a position in the pixel space of the series.
- useInterpolation
- Type:bool
- If true, interpolation should be used to get in-between values, rather than only the actual values in the data set.
- skipUnknowns
- Type:bool
- If true, unknown values should be skipped.
Code Sample
var item = $(".selector").igDataChart("getSeriesLowValueFromSeriesPixel", series1, {x:0.5, y:0.5}, true, true); -
getSeriesLowValuePosition
- .igDataChart( "getSeriesLowValuePosition", targetName:string, worldPoint:object, useInterpolation:bool, skipUnknowns:bool );
- Return Type:
- object
- Return Type Description:
- The position of the best available low value for the series in series pixel space.
If possible, will return the best available low value position of the series for a given world coordinate.
- targetName
- Type:string
- The name of the series to target.
- worldPoint
- Type:object
- The world position (in the form {x: [number from 0 to 1], y: [number from 0 to 1]} ) that represents a position in the space of the axes.
- useInterpolation
- Type:bool
- If true, interpolation should be used to get in-between values, rather than only the actual values in the data set.
- skipUnknowns
- Type:bool
- If true, unknown values should be skipped.
Code Sample
var item = $(".selector").igDataChart("getSeriesLowValuePosition", series1, {x:0.5, y:0.5}, true, true); -
getSeriesLowValuePositionFromSeriesPixel
- .igDataChart( "getSeriesLowValuePositionFromSeriesPixel", targetName:string, seriesPoint:object, useInterpolation:bool, skipUnknowns:bool );
- Return Type:
- object
- Return Type Description:
- The position (in the form {x: [number], y: [number]} ) of the best available low value for the series in series pixel space.
If possible, will return the best available low value position of the series for a given world coordinate.
- targetName
- Type:string
- The name of the series to target.
- seriesPoint
- Type:object
- The series pixel position (in the form {x: [number], y: [number]} that represents a position within the pixel space of the series.
- useInterpolation
- Type:bool
- If true, interpolation should be used to get in-between values, rather than only the actual values in the data set.
- skipUnknowns
- Type:bool
- If true, unknown values should be skipped.
Code Sample
var item = $(".selector").igDataChart("getSeriesLowValuePositionFromSeriesPixel", series1, {x:0.5, y:0.5}, true, true); -
getSeriesOffsetValue
- .igDataChart( "getSeriesOffsetValue", targetName:string );
- Return Type:
- number
- Return Type Description:
- The pixel category offset.
Gets the category offset for a series, if applicable.
- targetName
- Type:string
- The name of the series to target.
Code Sample
var item = $(".selector").igDataChart("getSeriesOffsetValue", series1); -
getSeriesValue
- .igDataChart( "getSeriesValue", targetName:string, worldPoint:object, useInterpolation:bool, skipUnknowns:bool );
- Return Type:
- number
- Return Type Description:
- The value of the series at the specified world coordinate, or double.NaN if unavailable.
If possible, will return the best available main value of the series for a given world coordinate.
- targetName
- Type:string
- The name of the series to target.
- worldPoint
- Type:object
- The world position (in the form {x: [number from 0 to 1], y: [number from 0 to 1]} ) that represents a position in the space of the axes.
- useInterpolation
- Type:bool
- If true, interpolation should be used to get in-between values, rather than only the actual values in the data set.
- skipUnknowns
- Type:bool
- If true, unknown values should be skipped.
Code Sample
var item = $(".selector").igDataChart("getSeriesValue", series1, {x:0.5, y:0.5}, true, true); -
getSeriesValueBoundingBox
- .igDataChart( "getSeriesValueBoundingBox", targetName:string, worldPoint:object );
- Return Type:
- object
- Return Type Description:
- The bounding box in question, or empty if no valid position is available. This will be an object literal with top, left, width, and height properties.
If possible, will return the best available value bounding box within the series that has the best value match for the world position provided.
- targetName
- Type:string
- The name of the series to target.
- worldPoint
- Type:object
- The world position (in the form {x: [number from 0 to 1], y: [number from 0 to 1]} ) that represents a position in the space of the axes.
-
getSeriesValueBoundingBoxFromSeriesPixel
- .igDataChart( "getSeriesValueBoundingBoxFromSeriesPixel", targetName:string, seriesPoint:object );
- Return Type:
- object
- Return Type Description:
- The bounding box in question, or empty if no valid position is available. This will be an object literal with top, left, width, and height properties.
If possible, will return the best available value bounding box within the series that has the best value match for the given series pixel coordinate.
- targetName
- Type:string
- The name of the series to target.
- seriesPoint
- Type:object
- The series pixel position (in the form {x: [number], y: [number]} ) that represents a position in the pixel space of the series.
-
getSeriesValueFineGrainedBoundingBoxes
- .igDataChart( "getSeriesValueFineGrainedBoundingBoxes", targetName:string, worldPoint:object );
- Return Type:
- object
- Return Type Description:
- The fine grained bounding boxes in question, or empty if no valid position is available. This will be an object literal with top, left, width, and height properties.
If possible, will return the best available value fine grained bounding boxes within the series that have the best value match for the world position provided.
- targetName
- Type:string
- The name of the series to target.
- worldPoint
- Type:object
- The world position (in the form {x: [number from 0 to 1], y: [number from 0 to 1]} ) that represents a position in the space of the axes.
-
getSeriesValueFineGrainedBoundingBoxesFromSeriesPixel
- .igDataChart( "getSeriesValueFineGrainedBoundingBoxesFromSeriesPixel", targetName:string, worldPoint:object );
- Return Type:
- object
- Return Type Description:
- The fine grained bounding boxes in question, or empty if no valid position is available. This will be an object literal with top, left, width, and height properties.
If possible, will return the best available value fine grained bounding boxes within the series that have the best value match for series pixel position provided.
- targetName
- Type:string
- The name of the series to target.
- worldPoint
- Type:object
- The series pixel position (in the form {x: [number], y: [number]} ) that represents a position in the pixel space of the series.
-
getSeriesValueFromSeriesPixel
- .igDataChart( "getSeriesValueFromSeriesPixel", targetName:string, seriesPoint:object, useInterpolation:bool, skipUnknowns:bool );
- Return Type:
- number
- Return Type Description:
- The value of the series at the specified world coordinate, or double.NaN if unavailable.
If possible, will return the best available main value of the series for a given world coordinate.
- targetName
- Type:string
- The name of the series to target.
- seriesPoint
- Type:object
- The series pixel position (in the form {x: [number], y: [number]} ) that represents a position in the pixel space of the series.
- useInterpolation
- Type:bool
- If true, interpolation should be used to get in-between values, rather than only the actual values in the data set.
- skipUnknowns
- Type:bool
- If true, unknown values should be skipped.
Code Sample
var item = $(".selector").igDataChart("getSeriesValueFromSeriesPixel", series1, {x:0.5, y:0.5}, true, true); -
getSeriesValuePosition
- .igDataChart( "getSeriesValuePosition", targetName:string, worldPoint:object, useInterpolation:bool, skipUnknowns:bool );
- Return Type:
- object
- Return Type Description:
- The position of the best available main value for the series in series pixel space.
If possible, will return the best available main value position of the series for a given world coordinate.
- targetName
- Type:string
- The name of the series to target.
- worldPoint
- Type:object
- The world position (in the form {x: [number from 0 to 1], y: [number from 0 to 1]} ) that represents a position in the space of the axes.
- useInterpolation
- Type:bool
- If true, interpolation should be used to get in-between values, rather than only the actual values in the data set.
- skipUnknowns
- Type:bool
- If true, unknown values should be skipped.
Code Sample
var item = $(".selector").igDataChart("getSeriesValuePosition", series1, {x:0.5, y:0.5}, true, true); -
getSeriesValuePositionFromSeriesPixel
- .igDataChart( "getSeriesValuePositionFromSeriesPixel", targetName:string, seriesPoint:object, useInterpolation:bool, skipUnknowns:bool );
- Return Type:
- object
- Return Type Description:
- The position (in the form {x: [number], y: [number]} ) of the best available main value for the series in series pixel space.
If possible, will return the best available main value position of the series for a given world coordinate.
- targetName
- Type:string
- The name of the series to target.
- seriesPoint
- Type:object
- The series pixel position (in the form {x: [number], y: [number]} that represents a position within the pixel space of the series.
- useInterpolation
- Type:bool
- If true, interpolation should be used to get in-between values, rather than only the actual values in the data set.
- skipUnknowns
- Type:bool
- If true, unknown values should be skipped.
Code Sample
var item = $(".selector").igDataChart("getSeriesValuePositionFromSeriesPixel", series1, {x:0.5, y:0.5}, true, true); -
id
- .igDataChart( "id" );
- Return Type:
- string
Returns the ID of parent element holding the chart.
Code Sample
var dataContainerElement = $(".selector").igDataChart("id"); -
insertItem
- .igDataChart( "insertItem", item:object, index:number, targetName:string );
Inserts a new item to the data source and notifies the chart.
- item
- Type:object
- the new item that we want to insert in the data source.
- index
- Type:number
- The index in the data source where the new item will be inserted.
- targetName
- Type:string
- The name of the series or axis bound to the data source.
Code Sample
$(".selector").igDataChart("insertItem", {"Item1": "Value1", "Item2": 1000, "Item3": 1019.75}, 1, "series1" ); -
moveCursorPoint
- .igDataChart( "moveCursorPoint", targetName:string, worldPoint:object );
- Return Type:
- object
- Return Type Description:
- Returns a reference to this chart.
Moves the cursor point of the target annotation layer to the desired world coordinates.
- targetName
- Type:string
- The name of the series to target.
- worldPoint
- Type:object
- The point to which to move the cursor. Should have an x property with type number and a y property with type number.
-
notifyClearItems
- .igDataChart( "notifyClearItems", dataSource:object );
- Return Type:
- object
- Return Type Description:
- Returns a reference to this chart.
Notifies the chart that the items have been cleared from an associated data source.
It's not necessary to notify more than one target of a change if they share the same items source.- dataSource
- Type:object
- The data source in which the change happened.
Code Sample
var response = $(".selector").igDataChart("notifyClearItems", series1DataSource); -
notifyInsertItem
- .igDataChart( "notifyInsertItem", dataSource:object, index:number, newItem:object );
- Return Type:
- object
- Return Type Description:
- Returns a reference to this chart.
Notifies the target axis or series that an item has been inserted at the specified index in its data source.
It's not necessary to notify more than one target of a change if they share the same items source.- dataSource
- Type:object
- The data source in which the change happened.
- index
- Type:number
- The index in the items source where the new item has been inserted.
- newItem
- Type:object
- the new item that has been set in the collection.
Code Sample
var response = $(".selector").igDataChart("notifyInsertItem", series1DataSource, 1, {"Item1": "Value1", "Item2": 1000, "Item3": 1019.75}); -
notifyRemoveItem
- .igDataChart( "notifyRemoveItem", dataSource:object, index:number, oldItem:object );
- Return Type:
- object
- Return Type Description:
- Returns a reference to this chart.
Notifies the target axis or series that an item has been removed from the specified index in its data source.
It's not necessary to notify more than one target of a change if they share the same items source.- dataSource
- Type:object
- The data source in which the change happened.
- index
- Type:number
- The index in the items source from where the old item has been removed.
- oldItem
- Type:object
- the old item that has been removed from the collection.
Code Sample
var response = $(".selector").igDataChart("notifyRemoveItem", series1DataSource, 1, {"Item1": "Value1", "Item2": 1000, "Item3": 1019.75}); -
notifySetItem
- .igDataChart( "notifySetItem", dataSource:object, index:number, newItem:object, oldItem:object );
- Return Type:
- object
- Return Type Description:
- Returns a reference to this chart.
Notifies the chart that an item has been set in an associated data source.
- dataSource
- Type:object
- The data source in which the change happened.
- index
- Type:number
- The index in the items source that has been changed.
- newItem
- Type:object
- the new item that has been set in the collection.
- oldItem
- Type:object
- the old item that has been overwritten in the collection.
Code Sample
var response = $(".selector").igDataChart("notifySetItem", series1DataSource, 1, {"Item1": "Value1", "Item2": 1000, "Item3": 1019.75}, {"Item1": "Value1", "Item2": 999, "Item3": 1019.75}); -
notifyVisualPropertiesChanged
- .igDataChart( "notifyVisualPropertiesChanged", targetName:string );
- Return Type:
- object
- Return Type Description:
- Returns a reference to this chart.
Notifies the target series that something that affects its visual properties has changed and the visual output needs a repaint.
- targetName
- Type:string
- The name of the series to notify.
-
option
- .igDataChart( "option" );
-
print
- .igDataChart( "print" );
Creates a print preview page with the chart, hiding all other elements on the page.
Code Sample
$(".selector").igDataChart("print"); -
removeItem
- .igDataChart( "removeItem", index:number, targetName:string );
Deletes an item from the data source and notifies the chart.
- index
- Type:number
- The index in the data source from where the item will be been removed.
- targetName
- Type:string
- The name of the series or axis bound to the data source. This is required only when the data is bound to series or axis. If the data is bound to dataSource of igDataChart, the second parameter should not be set.
Code Sample
$(".selector").igDataChart("removeItem", 1, "series1"); -
renderSeries
- .igDataChart( "renderSeries", targetName:string, animate:bool );
Indicates that a series should render, even though no option has been modified that would normally cause it to refresh.
- targetName
- Type:string
- The name of the series to render.
- animate
- Type:bool
- Whether the change should be animated, if possible.
Code Sample
$(".selector").igDataChart("renderSeries", "xAxis", true); -
replayTransitionIn
- .igDataChart( "replayTransitionIn", targetName:string );
- Return Type:
- object
- Return Type Description:
- Returns a reference to this chart.
Replays the transition in animation for a series, if applicable.
- targetName
- Type:string
- The name of the series to target.
-
resetCachedEnhancedInterval
- .igDataChart( "resetCachedEnhancedInterval", targetName:string );
- Return Type:
- object
- Return Type Description:
- Returns a reference to this chart.
For the target axis, if using enhanced interval management and precise interval fitting, this will reset the cached maximum label width, and recalculate using the current labels.
- targetName
- Type:string
- The name of the axis to notify.
-
resetZoom
- .igDataChart( "resetZoom" );
- Return Type:
- object
- Return Type Description:
- Returns a reference to this igChart.
Resets the zoom level of the chart to default.
Code Sample
var response = $(".selector").igDataChart("resetZoom"); -
scaleValue
- .igDataChart( "scaleValue", targetName:string, unscaledValue:number );
- Return Type:
- number
- Return Type Description:
- Returns the scaled value.
Notifies the target axis that it should scale the requested value into chart space from axis space.
For example you can use this method if you want to find where value 50 of the x axis stands scaled to chart's width.- targetName
- Type:string
- The name of the axis to notify.
- unscaledValue
- Type:number
- The value in axis space to translate into chart space.
Code Sample
var scaled = $(".selector").igDataChart("scaleValue", "axis1", 250); -
scrollIntoView
- .igDataChart( "scrollIntoView", targetName:string, item:object );
- Return Type:
- object
- Return Type Description:
- Returns a reference to this chart.
Notifies the target axis or series that it should scroll the requested data item into view.
- targetName
- Type:string
- The name of the axis or series notify.
- item
- Type:object
- The data item to bring into view, if possible.
Code Sample
var response = $(".selector").igDataChart("scrollIntoView", 5); -
setItem
- .igDataChart( "setItem", index:number, item:object, targetName:string );
Updates an item in the data source and notifies the chart.
- index
- Type:number
- The index of the item in the data source that we want to change.
- item
- Type:object
- The new item object that will be set in the data source.
- targetName
- Type:string
- The name of the series or axis bound to the data source.
Code Sample
$(".selector").igDataChart("setItem", 5, {"Item1": "Value1", "Item2": 1000, "Item3": 1019.75}, "series1"); -
simulateHover
- .igDataChart( "simulateHover", targetName:string, seriesPoint:object );
- Return Type:
- object
- Return Type Description:
- Returns a reference to this chart.
Simulates a hover interaction over a given point in the viewport of a series.
- targetName
- Type:string
- The name of the series to target.
- seriesPoint
- Type:object
- The point at which to hover. Should have an x property with type number and a y property with type number.
-
startTiledZoomingIfNecessary
- .igDataChart( "startTiledZoomingIfNecessary" );
Manually starts a tiled zoom if one isn't already running.
-
styleUpdated
- .igDataChart( "styleUpdated" );
- Return Type:
- object
- Return Type Description:
- Returns a reference to this igChart.
Notify the chart that styles it draws colors from may have been updated.
Code Sample
var response = $(".selector").igDataChart("styleUpdated"); -
unscaleValue
- .igDataChart( "unscaleValue", targetName:string, scaledValue:number );
- Return Type:
- number
- Return Type Description:
- Returns the unscaled value.
Notifies the target axis that it should unscale the requested value into axis space from chart space.
For example you can use this method if you want to find what is the value of x axis unscaled from 0 width of the chart.- targetName
- Type:string
- The name of the axis to notify.
- scaledValue
- Type:number
- The value in chart space to translate into axis space.
Code Sample
var unscaled = $(".selector").igDataChart("unscaleValue", "axis1", 50); -
widget
- .igDataChart( "widget" );
Returns the element holding the chart.
Code Sample
var chartWidget = $(".selector").igDataChart("widget");
-
ui-chart-aligned-gridlines
- When the visibility CSS property is set to visible for this class, all grid lines in the chart will be snapped to the nearest pixel.
-
ui-angular-axis-labels
- Class applying font color to the labels of angular axes.
-
ui-chart-area-fill-opacity
- Class applying opacity value to the fill shape of all area-like series.
-
ui-chart-axis
- Class applying border-color to all of the chart axis lines.
-
ui-chart-axis-major-line
- Class applying border-color to the chart axes major lines. Transparent is treated as auto meaning that the chart decides which lines to be displayed based on the series types used in it. For horizontal category series (Column, Line, Area), only horizontal lines are displayed. For vertical category series (Bar), only vertical lines are displayed. For scatter, polar and radial series all gridlines are displayed.
-
ui-chart-axis-stroke
- Class applying border-color to the chart axes stroke lines. Transparent is treated as auto meaning that the chart decides which lines to be displayed based on the series types used in it. For horizontal category series (Column, Line, Area), only horizontal lines are displayed. For vertical category series (Bar), only vertical lines are displayed. For scatter, polar and radial series all gridlines are displayed.
-
ui-chart-category-axis-tick
- Class used for specifying width/height for the tick marks of the category axes.
-
ui-corner-all ui-widget-content ui-chart-container
- Classes applied on a div element.
-
ui-horizontal-axis-labels
- Class applying font color, margin, and vertical alignment to the labels of horizontal axes.
-
ui-chart-horizontal-axis-title
- Class applying font, color, and margin to the title of horizontal chart axes.
-
ui-chart-legend-item-badge
- Class setting all styling options to legend item icons.
-
ui-chart-legend-items-list
- Class setting all styling options to chart legends.
-
ui-chart-legend-item-text
- Class setting all styling options to legend item text.
-
ui-radial-axis-labels
- Class applying font color, margin, and vertical alignment to the labels of radial axes.
-
ui-chart-fill-palette-n
- Class applying background-image to the fill of the n-th series in the chart. Only gradient colors are accepted. As many palettes can be defined as neccessary.
-
ui-chart-outline-palette-n
- Class applying background-image to the outline of the n-th series in the chart. Only gradient colors are accepted. As many palettes can be defined as neccessary.
-
ui-chart-palette-n
- Class applying background-color and border-color to the n-th series in the chart. As many palettes can be defined as neccessary.
-
ui-chart-subtitle
- Class applying font, color, and margin to the chart subtitle.
-
ui-chart-title
- Class applying font, color, and margin to the chart title.
-
ui-chart-tooltip ui-widget-content ui-corner-all
- Classes applied to the tooltip div element.
-
ui-html5-non-html5-supported-message ui-helper-clearfix ui-html5-non-html5
- Classes applied on a div element, shown when the chart is opened in a non HTML5 compatible browser.
-
ui-vertical-axis-labels
- Class applying font color, margin, and horizontal (text) alignment to the labels of vertical axes.
-
ui-chart-vertical-axis-title
- Class applying font, color, and margin to the title of vertical chart axes.