
This topic demonstrates, with code examples, how to add the igBulletGraph™ to an ASP.NET MVC application using the ASP.NET MVC helper.
The following table lists the concepts and topics required as a prerequisite to understanding this topic.
Concepts
Topics
igBulletGraph control including its main features, minimum requirements, and user functionality.This topic contains the following sections:
The igBulletGraph control can be added to an ASP.NET MVC view using the ASP.NET MVC helper. In order to successfully display the bullet graph, the dimensions of the control should be specified. When instantiating the igBulletGraph control, there are several helper methods that should be set for basic rendering including the following:
Width(): Sets the width of the igBulletGraph.
Height(): Sets the height of the igBulletGraph.
MinimumValue(): Sets the start value for the scale’s range.
MaximumValue(): Sets the end value for the scale’s range.
Value(): Sets the value which determines the end position of the performance bar.
TargetValue(): Sets the value indicated by the comparative marker.
Ranges(): Instantiates range objects for the igBulletGraph.
Apart from its startValue and endValue, a name must be assigned to the individual range, so that its extent is specified.
To complete the procedure, you need the following:
The dependencies of the View:
The Infragistics.Web.Mvc namespace added to the ASP.NET MVC View
In ASPX:
<%@ Import Namespace="Infragistics.Web.Mvc" %>
References to the combined Java Script files for all data visualization controls and to the required CSS files added to the <head> tag of the ASP.NET MVC View
In ASPX:
<link href="<%=Url.Content("~/Scripts/css/themes/infragistics/infragistics.theme.css")%>" rel="stylesheet"></link>
<link href="<%=Url.Content("~/Scripts/css/structure/infragistics.css")%>" rel="stylesheet"></link>
<script src="<%=Url.Content("~/Scripts/jquery.min.js")%>" type="text/javascript"></script>
<script src="<%=Url.Content("~/Scripts/jquery-ui.min.js")%>" type="text/javascript"></script>
<script src="<%=Url.Content("~/Scripts/js/infragistics.core.js")%>" type="text/javascript"></script>
<script src="<%=Url.Content("~/Scripts/js/infragistics.dv.js")%>" type="text/javascript"></script>
Alternatively, you can use the Infragistics Loader (the igLoader component) or explicitly include all igBulletGraph-related files as explained in the Adding igBulletGraph to an HTML Page topic.
igBulletGraph control configuring its basic rendering optionsThis procedure adds an instance of igBulletGraph to an ASP.NET MVC application using the ASP.NET MVC helper for the control and configures its basic options - width and height. It also configures its scale and adds a performance bar, comparative marker and three comparative ranges to it. The procedure presumes that a reference to the Infragistics.Web.Mvc.dll assembly has been added to project and the control is rendered to the View with the ASP.NET MVC helper’s Render() method.
The following screenshot is a preview of the result.
An ASP.NET MVC application configured with the required JavaScript files, CSS files and ASP.NET MVC assembly as defined in the Prerequisites of the Adding igBulletGraph to an ASP.NET MVC Application procedure.
The following steps demonstrate how to instantiate igBulletGraph in an ASP.NET MVC application using the ASP.NET MVC helper.
1. Add the ASP.NET MVC Helper.
Add the ASP.NET MVC helper to the body of your ASP.NET page.
In ASPX:
<body>
<%=(Html.Infragistics().BulletGraph()
.Render())%>
</body>
2. Instantiate the igBulletGraph control configuring its basic rendering options.
Instantiate the igBulletGraph control. As with all Ignite UI for MVC controls, you must call the Render method to render the HTML and JavaScript to the View.
In ASPX:
<body>
    <%= Html.Infragistics().BulletGraph()
                    .Width("300px")
                    .Height("70px").Render()%>
</body>
3. Configure the scale.
In order to customize the values of the scale, you need to supply values for the MinimumValue() and MaximumValue() methods. In this example, the scale will start at 5 and end at 55.
In ASPX:
<%= Html.Infragistics().BulletGraph()
                .Width("300px")
                .Height("70px")
                .MinimumValue(5)
                .MaximumValue(55).Render()%>
The changed scale is shown on the following screenshot:

4. Add performance bar.
Add the performance bar by setting the igBulletGraph's Value() method. For this example, set this value to 35.
In ASPX:
<%= Html.Infragistics().BulletGraph()
                ...
                .Value(35)
                .Render()%>
5. Configure the comparative marker.
To position the comparative measure marker on the scale, set the TargetValue() method value. For this example, set the value to 43.
In ASPX:
<%= Html.Infragistics().BulletGraph()
                ...
                .TargetValue(43)
                .Render()%>
The following screenshot displays what the igBulletGraph control would look so far in the procedure.

6. Add comparative ranges.
Within the Ranges() method, define the individual comparative ranges. The starting and ending values are configured individually for each range ( parameters of StartValue() and EndValue()) and color (Brush()).
For this example, configure 3 comparative ranges, each of a different shade of gray, starting at the 0, 15, and 30 tick marks of the scale, respectively.
In ASPX:
<%= Html.Infragistics().BulletGraph()
                ...
                .Ranges(range =>
                    {
                        range.Range("range1").StartValue(0).EndValue(15).Brush("#DCDCDC");
                        range.Range("range2").StartValue(15).EndValue(30).Brush("#A9A9A9");
                        range.Range("range3").StartValue(30).EndValue(55).Brush("#808080");
                    })
                .Render()%>
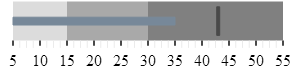
The final look of the graph is presented below.
Following is the full code for this procedure.
In ASPX:
<%@ Import Namespace="Infragistics.Web.Mvc" %>
<!DOCTYPE html>
<html>
<head>
<title>BulletGraph</title>
<link href="<%=Url.Content("~/Scripts/css/themes/infragistics/infragistics.theme.css")%>" rel="stylesheet"></link>
<link href="<%=Url.Content("~/Scripts/css/structure/infragistics.css")%>" rel="stylesheet"></link>
<script src="<%=Url.Content("~/Scripts/jquery.min.js")%>" type="text/javascript"></script>
<script src="<%=Url.Content("~/Scripts/jquery-ui.min.js")%>" type="text/javascript"></script>
<script src="<%=Url.Content("~/Scripts/js/infragistics.core.js")%>" type="text/javascript"></script>
<script src="<%=Url.Content("~/Scripts/js/infragistics.dv.js")%>" type="text/javascript"></script>
</head>
<body>
    <%= Html.Infragistics().BulletGraph()
                    .Width("300px")
                    .Height("70px")
                    .MinimumValue(5)
                    .MaximumValue(55)
                    .Value(35)
                    .TargetValue(43)
                    .Ranges(range =>
                        {
                            range.Range("range1").StartValue(0).EndValue(15).Brush("#DCDCDC");
                            range.Range("range2").StartValue(15).EndValue(30).Brush("#A9A9A9");
                            range.Range("range3").StartValue(30).EndValue(55).Brush("#808080");
                        })
                    .Render()%>
</body>
</html>
The following topics provide additional information related to this topic.
Adding igBulletGraph to an HTML Page: This topic demonstrates, with code examples, how to add the igBulletGraph control to an HTML page.
jQuery and MVC API Links (igBulletGraph): This topic provides links to the API reference documentation about the igBulletGraph control and its ASP.NET MVC Helper.
The following sample provides additional information related to this topic.
View on GitHub