
This topic demonstrates how to add the igPieChart™ control to a web page and bind it to data.
The following table lists the materials required as a prerequisite to understanding this topic.
Concepts
Topics
Ignite UI for jQuery Overview: General information on the Ignite UI for jQuery™ library.
Using JavaScript Resources in Ignite UI for jQuery: This topic provides general guidance on adding required JavaScript resources to use controls from the Ignite UI for jQuery library.
igPieChart Overview: This topic provides conceptual information about the igPieChart control including its main features, minimum requirements for using charts and user functionality.
This topic contains the following sections:
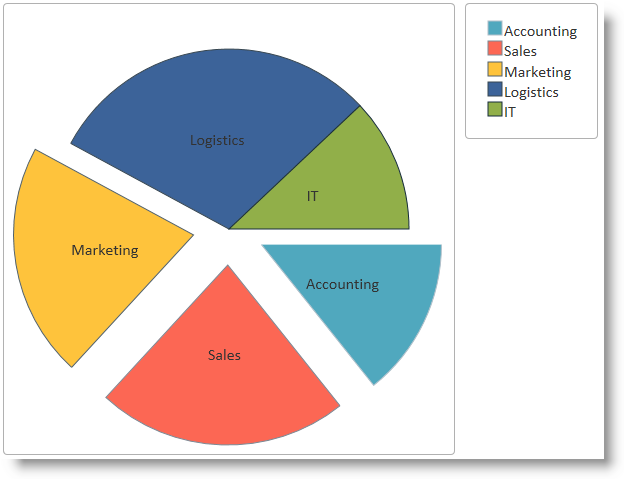
This procedure guides you through the process of adding a pie chart control with legend to a web page. The data for the chart in the example is supplied into a JavaScript array.
The following screenshot is a preview of the final result.
To complete the procedure, you need the following:
This topic takes you step-by-step toward adding a pie chart to a web page The following is a conceptual overview of the process:
igLoaderigPieChartThe following steps demonstrate how to add an igPieChart control to a web page.
Add references to the required resources.
Overview
Reference the required resources. Referencing resources includes:
Adding the Ignite UI for jQuery JavaScript files to a folder named Scripts/ig in your web site or web application (see the Using JavaScript Resources in Ignite UI for jQuery topic for details).
The resources can be added either manually or using loaders (recommended).
Referencing resources in JavaScript using the igLoader
The igLoader™ control is the recommended way to load JavaScript and CSS resources required by the Ignite UI for jQuery library controls. First the igLoader script must be included in the page:
In HTML:
<script type="text/javascript" src="Content/ig/infragistics.loader.js"></script>
For HTML views the igLoader must be instantiated this way:
In HTML:
<script type="text/javascript">
$.ig.loader({
    scriptPath: "Scripts/ig/",
    cssPath: "Content/ig/",
    resources: "igPieChart,igChartLegend"
});
<script>
The resources option specifies that the igPieChart control will be rendered.
Referencing resources in MVC using the MVC Loader
The Infragistics.Web.Mvc assembly must be referenced in your ASP.NET MVC project and the corresponding namespace must be referenced in your view. For details, see Using JavaScript Resources in Ignite UI for jQuery but for clarity the code to reference the namespace is given here.
For MVC views Ignite UI for MVC Loader must be used:
In ASPX:
<%@ Import Namespace="Infragistics.Web.Mvc" %>
<%= Html.Infragistics().Loader()
    .ScriptPath(Url.Content("~/Scripts/ig/"))
    .CssPath(Url.Content("~/Content/ig/"))
    .Render()
%>
The Ignite UI for MVC Loader automatically detects required resources and specifying resources is not necessary.
Referencing resources manually
For manual loading, refer to the Minimum Requirements block in the igPieChart Overview topic to see which resource files must be linked to use pie charts.
Add HTML markup required by the igPieChart.
HTML example
Add the div elements for the chart and the legend which will be referred in the chart instantiation code.
In HTML:
 <div id="chart" class="chartContainer"></div>
 <div id="legend" class="chartContainer"></div>
ASP.NET Example
For ASP.NET MVC, no container elements are needed because the Ignite UI for MVC adds the required markup automatically.
Add the data source.
HTML example
For the HTML example some JavaScript code must be added that defines an array with several data records for company budget data. In order to get information on binding to other data sources you may refer to the Data Binding (igPieChart) topic.
Include the following code in the head section of your HTML document.
In HTML:
 <script type="text/javascript">
     var data = [
             { "Budget": 950000, "Department": "Accounting" },
             { "Budget": 1500000, "Department": "Sales" },
             { "Budget": 1400000, "Department": "Marketing" },
             { "Budget": 2000000, "Department": "Logistics" },
             { "Budget": 800000, "Department": "IT" }
         ];
 </script>
ASP.NET example
The way to supply data for an ASP.NET MVC view is through a controller method and appropriate data model definition. Here follows the data model part. Create a new empty class into the Models folder of you ASP.NET MVC application and add the following code.
In C#:
 public class DepartmentSpending
 {
     public string Department { get; set; }
     public decimal Budget { get; set; }
 }
Add an empty controller class in the Controllers folder and the following code for the Index (or whatever your view is named) method:
In C#:
 public ActionResult Index()
 {
     List<DepartmentSpending> companyBudget = new List<DepartmentSpending>
     {
         new DepartmentSpending { Budget = 950000, Department = "Accounting" },
         new DepartmentSpending { Budget = 1500000, Department = "Sales" },
         new DepartmentSpending { Budget = 1400000, Department = "Marketing" },
         new DepartmentSpending { Budget = 2000000, Department = "Logistics" },
         new DepartmentSpending { Budget = 500000, Department = "IT" }
     };
     return View(companyBudget.AsQueryable());
 }
Add the following code in your ASP.NET MVC view to make it strongly-typed and point to the data model class created above.
In ASPX:
<%@ Page Language="C#" Inherits="System.Web.Mvc.ViewPage<IQueryable<PieChartSample.Models.DepartmentSpending>>" %>
Instantiate the pie chart.
HTML example
the chart and legend div tags to be wrapped and chart drawn, the igPieChart control must be instantiated and its main options set. Add the code below to the existing code in the <script> tag used above for data array definition:
In Javascript:
 $(function () {
     $("#chart").igPieChart({
         width: "450px",
         height: "450px",
         dataSource: data,
         dataValue: "Budget",
         dataLabel: "Department",
         radiusFactor: 0.8,
         explodedSlices: '0 1 2',
         legend: { element: "legend", type: "item"}
     });
 });
The width and height options set explicitly the size of the chart container but may be omitted and the control will calculate appropriate size automatically.
The option radiusFactor sets the size of the pie relative to the size of the container element set by width and height and by default it is 0.9. The option explodedSlices is a space delimited list of indices of slices and determines which slices are displayed detached from the main pie. Slices start from an imaginary line to the right from the center of the pie and are counted clockwise.
Note how the previously defined array data has been assigned to the dataSource option of the chart control. The options dataValue and dataLabel are mandatory since they configure which members from the input data will be displayed on the chart. The option dataValue is visualized in the form of slice size, i.e. the relative value (or percentage) of this member related to the sum of all members determines the slice size. The option dataLabel is visualized in the form of slice labels to denote each slice and also in the legend if such exists.
An important setting for the legend is the legend type specified by the type option in the legend object. The type item must be specified whenever a pie chart is used because this creates legend item for each data item in the data source depicted.
ASP.NET example
The code below instantiates and sets the main features of the igPieChart using the Ignite UI for MVC PieChart provided in the Infragistics.Web.Mvc assembly. The data model is associated with the control with the PieChart(Model) call and the rest of the calls act similarly to the HTML example.
In ASPX:
 <%= Html.Infragistics().PieChart(Model)
         .ID("chart")
         .Height("450px")
         .Width("450px")
         .DataValue(item => item.Budget)
         .DataLabel(item => item.Department)
         .RadiusFactor(0.8)
         .ExplodedSlices("0 1 2")
         .Legend(legend => legend.ID("legend").LegendType(LegendType.Item))
         .DataBind()
         .Render()
 %>
To verify the result, save the page and view the final result in a web browser. The pie chart should render as shown in the Preview.
The following topics provide additional information related to this topic.
Data Binding (igPieChart): This topic explains how to bind various data sources to the igPieChart™ control.
jQuery and MVC API Reference Links (igPieChart): This topic provides links to the API documentation for jQuery and Ignite UI for MVC class for igDataChart™ control.
Styling igPieChart with Themes: Demonstrates using styles and applying themes with igPieChart™.
The following samples provide additional information related to this topic.
The following material (available outside the Infragistics family of content) provides additional information related to this topic.
jQuery Home Page: The home page of the jQuery library where more detailed information on installing and features of the library can be found.
ASP.NET MVC Home Page: The home page of ASP.NET MVC where more detailed information on installing and using ASP.NET MVC can be found.
View on GitHub